Runtime Environments
Path: /runtimes, /runtimes/:infraId
This page allows you to register and manage the infrastructure environments where your services will actually run. You can centrally manage Kubernetes clusters, Docker hosts, and Podman environments all in one place.
If you cannot access this page, please request Runtime Management permission from your organization administrator. Runtime environments are the foundation for service deployment, so proper permission management is important.
Why Runtime Environment Management Matters
To deploy a service, you first need to decide where to deploy it. Runtime environments represent that "where."
- Separate Dev/Staging/Production Environments: Register appropriate runtimes for each environment to deploy safely.
- Resource Visibility: Monitor CPU and memory usage of each runtime for capacity planning.
- Centralized Management: Manage multiple clusters and hosts from one place to improve operational efficiency
If you're new to KIWI, first register your servers on the Device Management page, then set up your runtime environments here.
Supported Runtime Types
KIWI supports three container runtime environments. Understand the characteristics of each type and choose the environment that fits your project.
- Kubernetes: Container orchestration platform. Supports auto-scaling, rolling updates, and self-healing. Recommended for large-scale production environments and microservices architecture.
- Docker: The most widely used container runtime. Simple and intuitive to use. Recommended for development environments, small services, and single-host deployments.
- Podman: Rootless container runtime. Docker-compatible with enhanced security. Recommended for security-critical environments and when operating without root privileges.
Container orchestration is a technology that automates the deployment, management, scaling, and networking of multiple containers. When you have many containers, manual management becomes difficult, and orchestration tools like Kubernetes handle this automatically.
Key Features by Runtime Type
Kubernetes Cluster Management
Kubernetes provides the most powerful container management capabilities.
- Node Status Monitoring: View the Ready/NotReady status of each node (server) in real-time. Quickly identify nodes with issues.
- Namespace Management: Logically separate resources within the cluster. For example, you can run
dev,staging, andprodenvironments separately in a single cluster. - Resource Usage Monitoring: Monitor CPU and memory usage to prevent resource shortage situations proactively.
- Metrics Server Installation: One-click installation of the server for resource metrics collection. Required for HPA (auto-scaling) and the
kubectl topcommand.
A Namespace is a method for logically separating cluster resources in Kubernetes. Like folders, you can group and manage related resources together. Useful for separation by environment (dev, staging, prod) or by team.
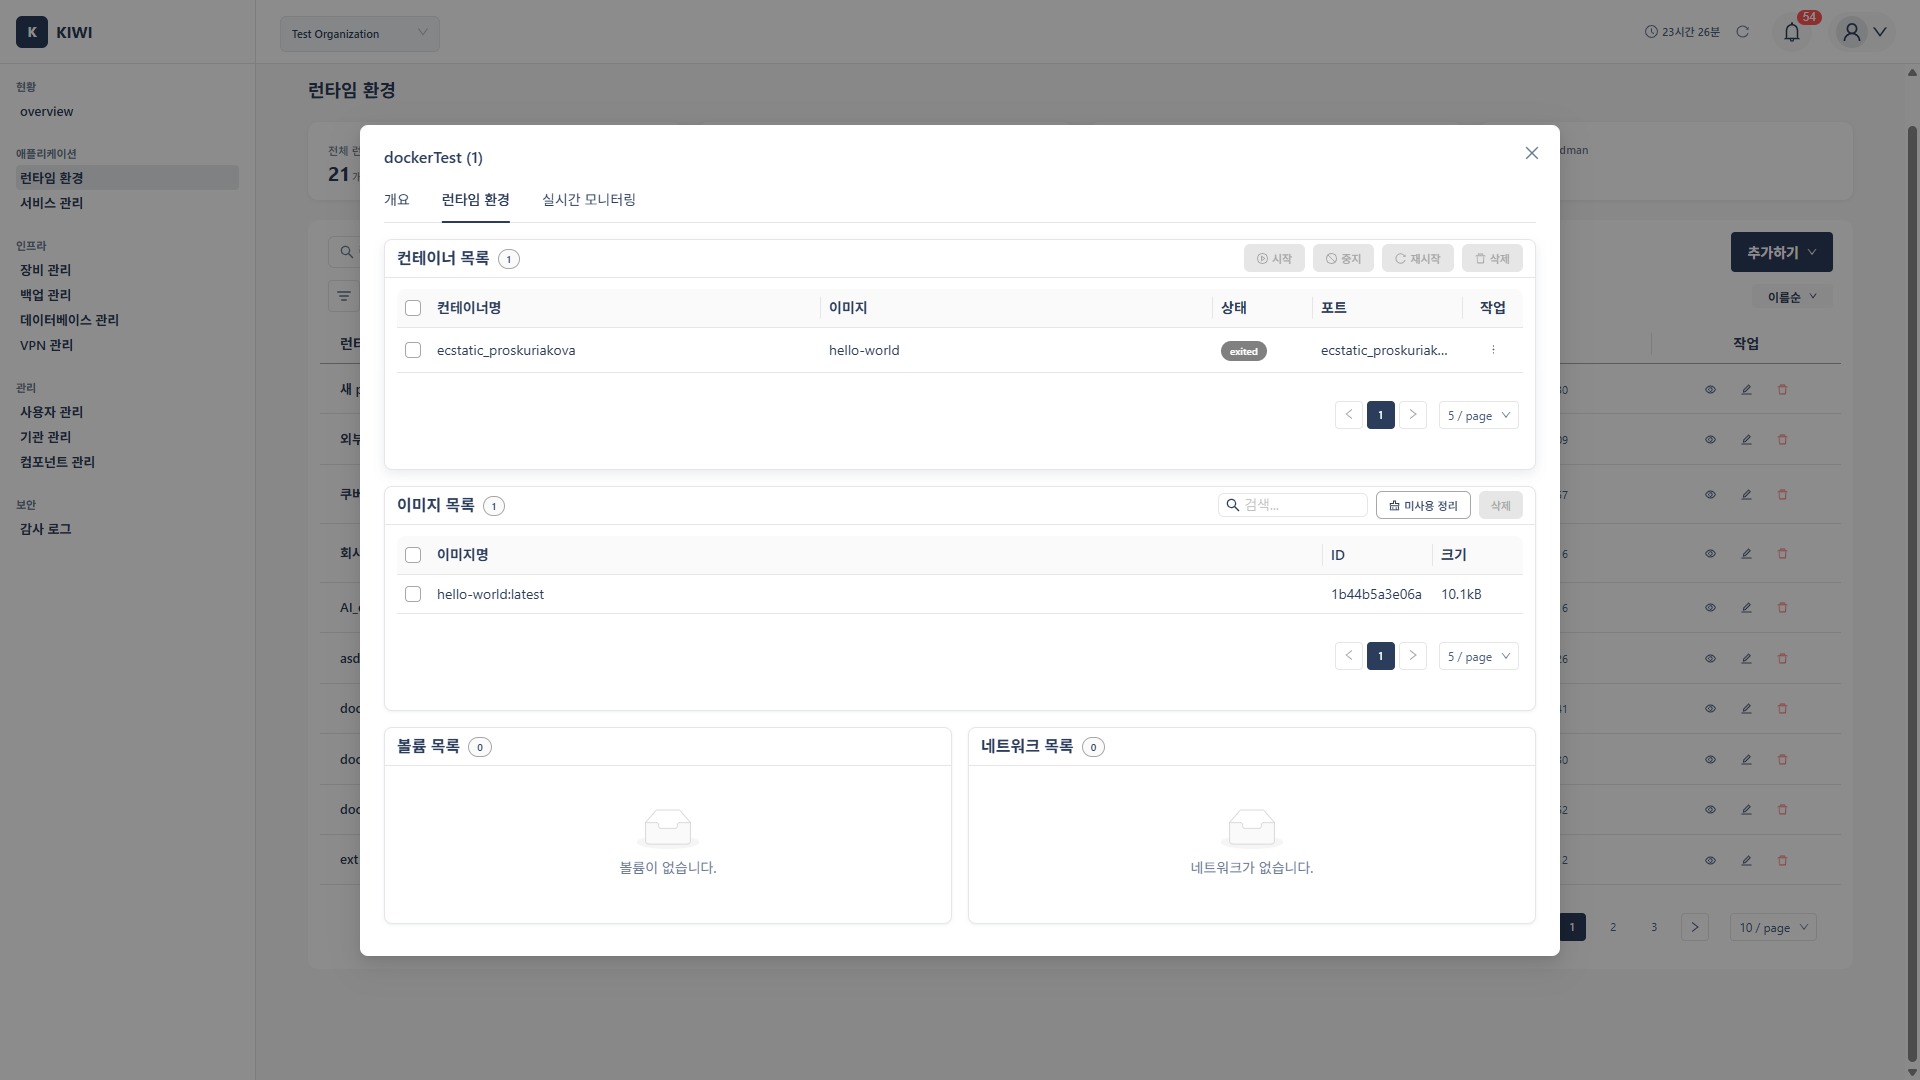
Docker/Podman Host Management
Docker and Podman are suitable for managing containers in single-host environments.
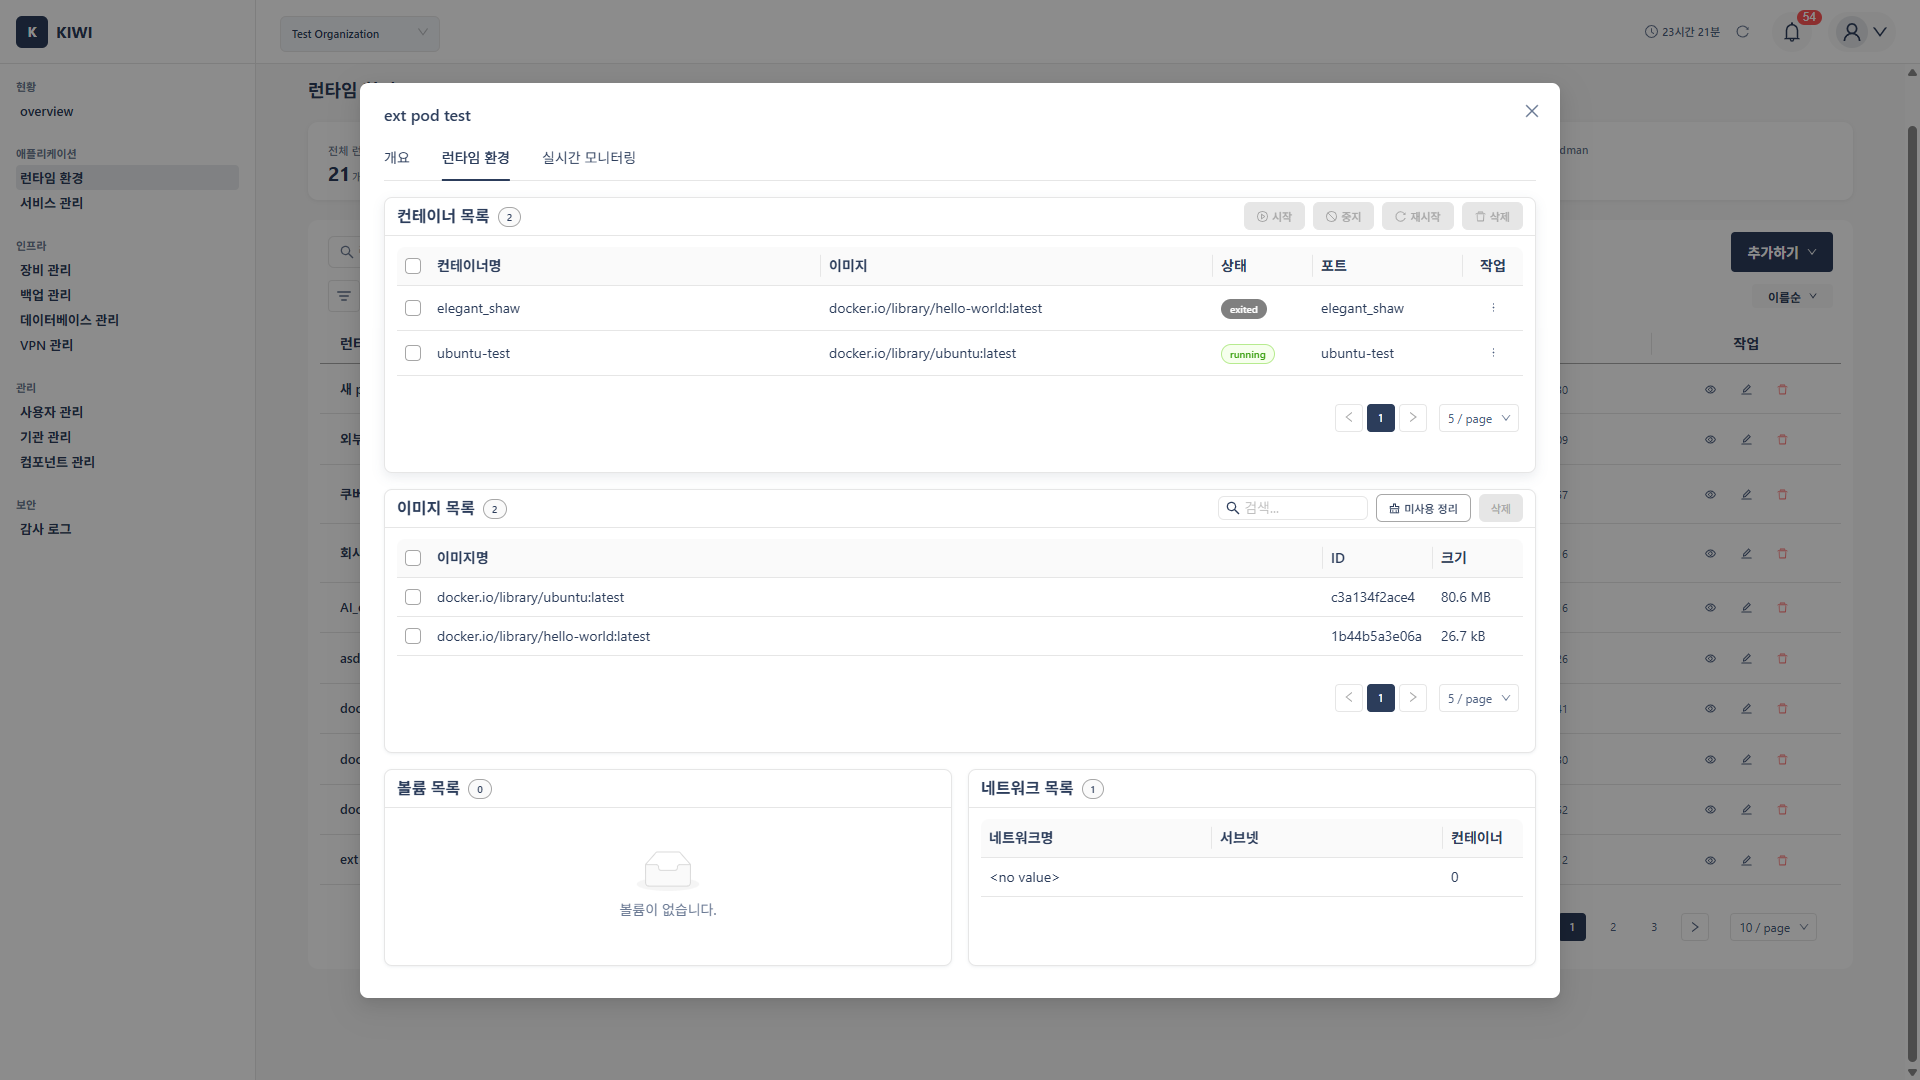
- Container Management: View the list and status of running containers, and start/stop/restart them.
- Image Management: Browse and manage locally stored container images. Clean up unnecessary images to free disk space.
- Volume Management: Manage volumes for persistent container data storage.
Podman uses almost identical commands to Docker, but can run containers without root privileges, providing higher security. Podman is recommended for environments with strict security policies.
Understanding the UI
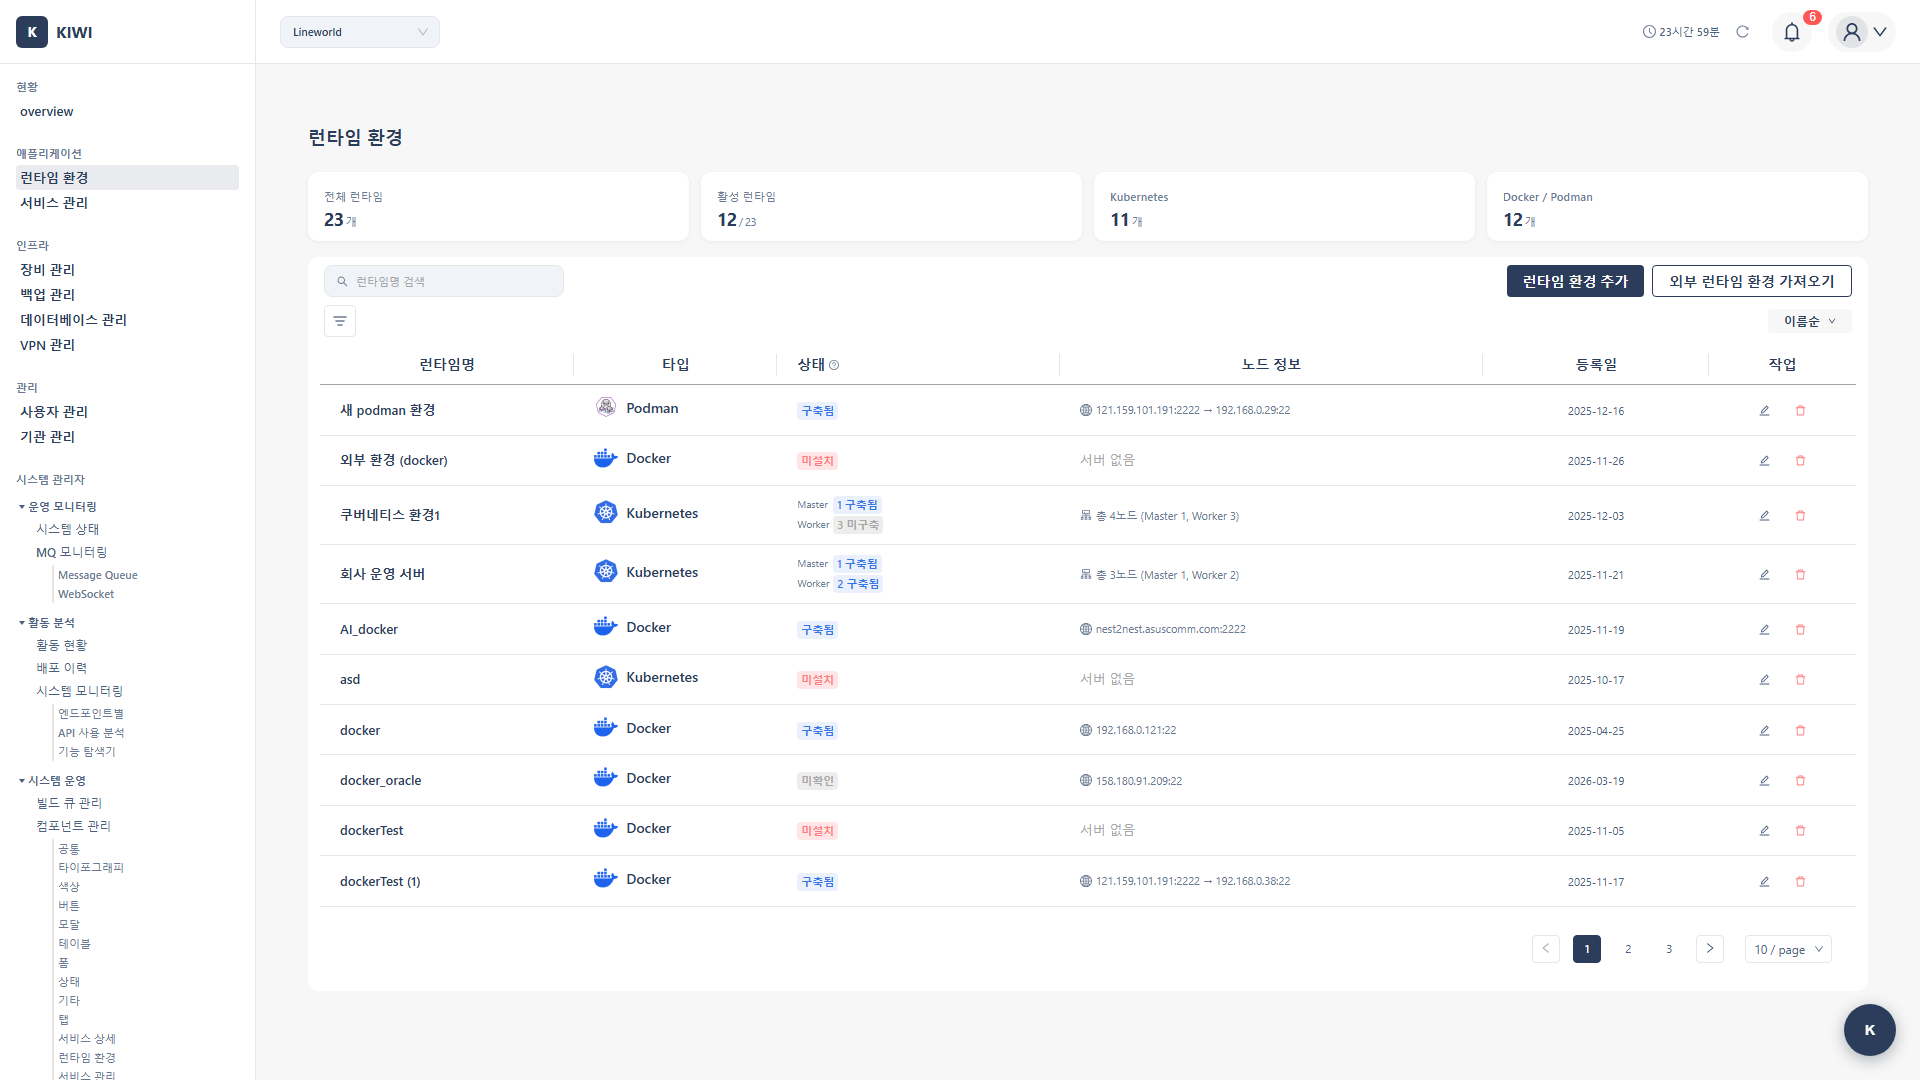
Runtime List Screen
The runtime list shows all registered runtime environments at a glance.
- Name: Identification name for the runtime environment (e.g.,
prod-cluster,dev-docker). - Type: Kubernetes, Docker, or Podman.
- Node Count: Number of nodes in the cluster (for Kubernetes).
- Health Status: Connection status of the runtime (Healthy/Warning/Error).
Actions available for each runtime:
- View Details: Click the runtime name to navigate to the detail page
- Edit Settings: Click the gear icon to modify settings.
- Delete: Unregister runtimes that are no longer in use
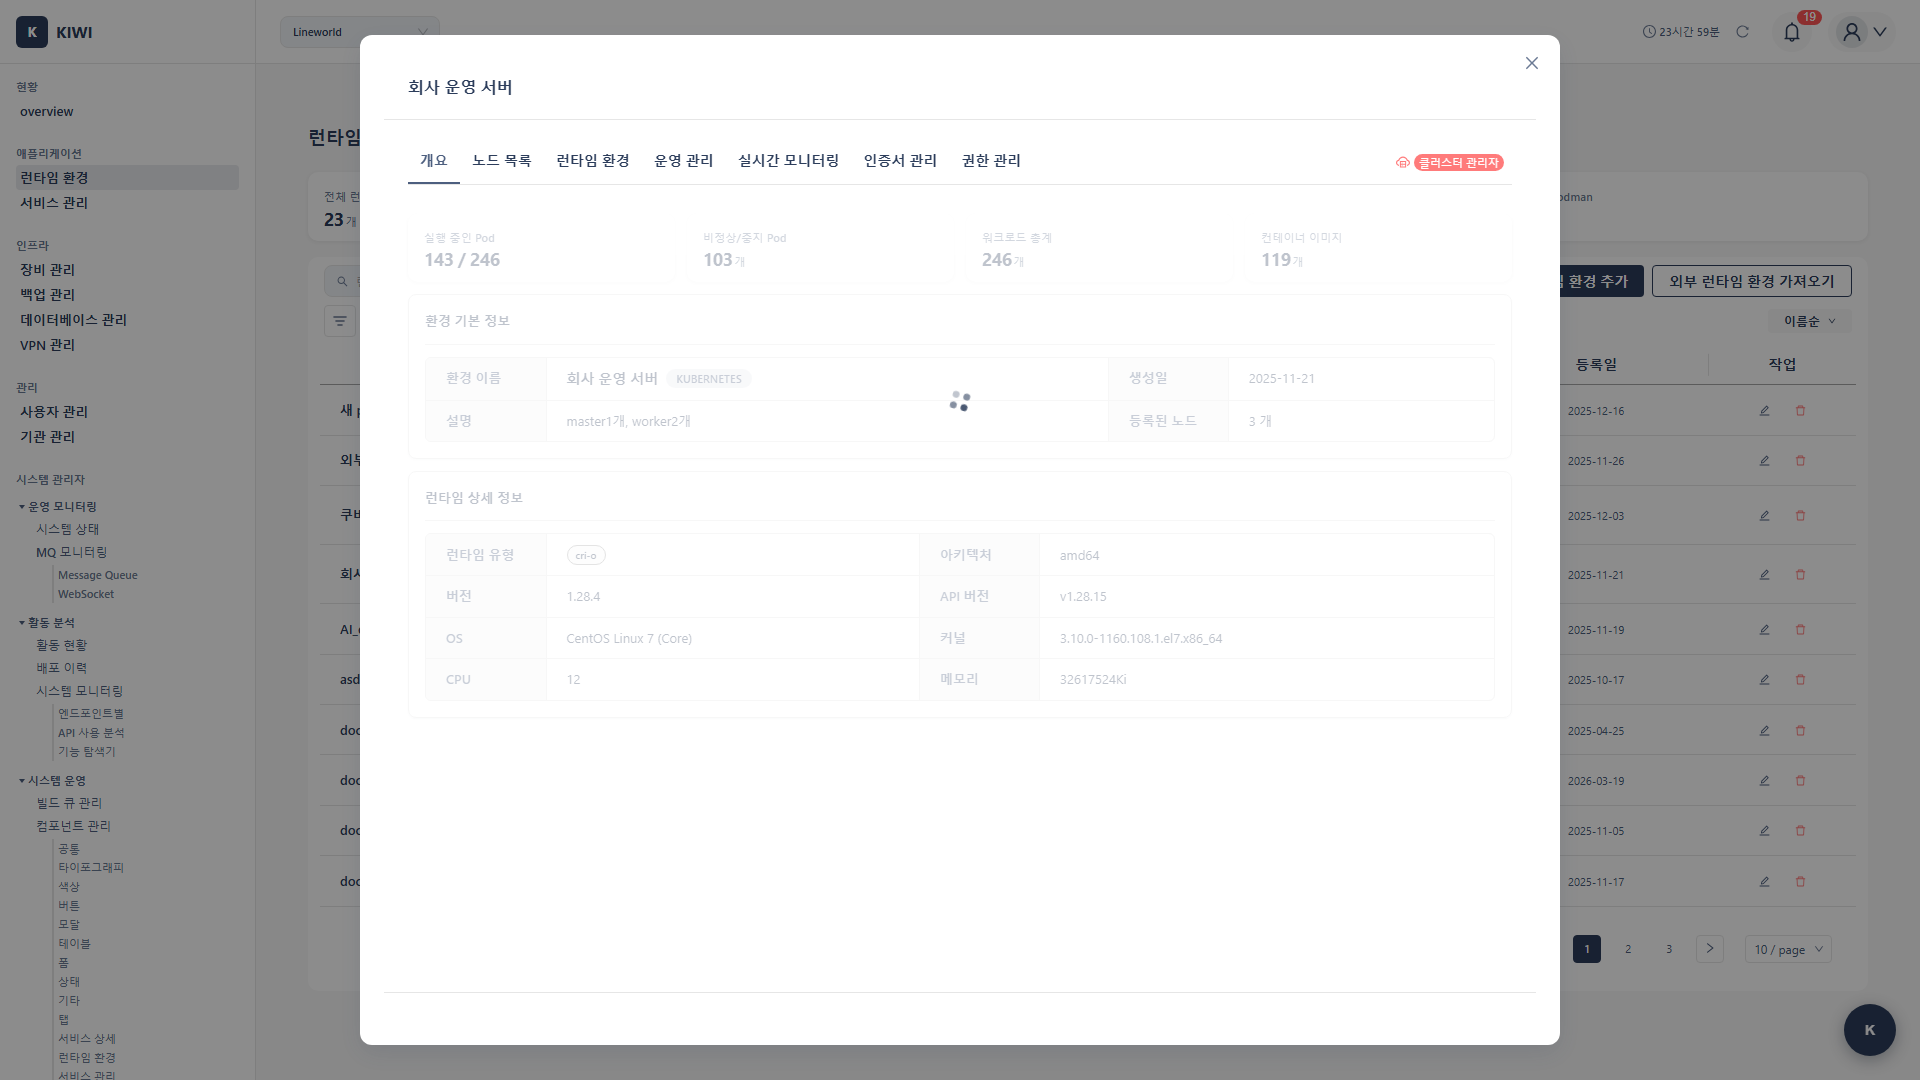
Kubernetes Detail Page Tabs
The Kubernetes runtime detail page consists of various tabs.
- Overview: Cluster-wide status summary, view node/Pod status at a glance.
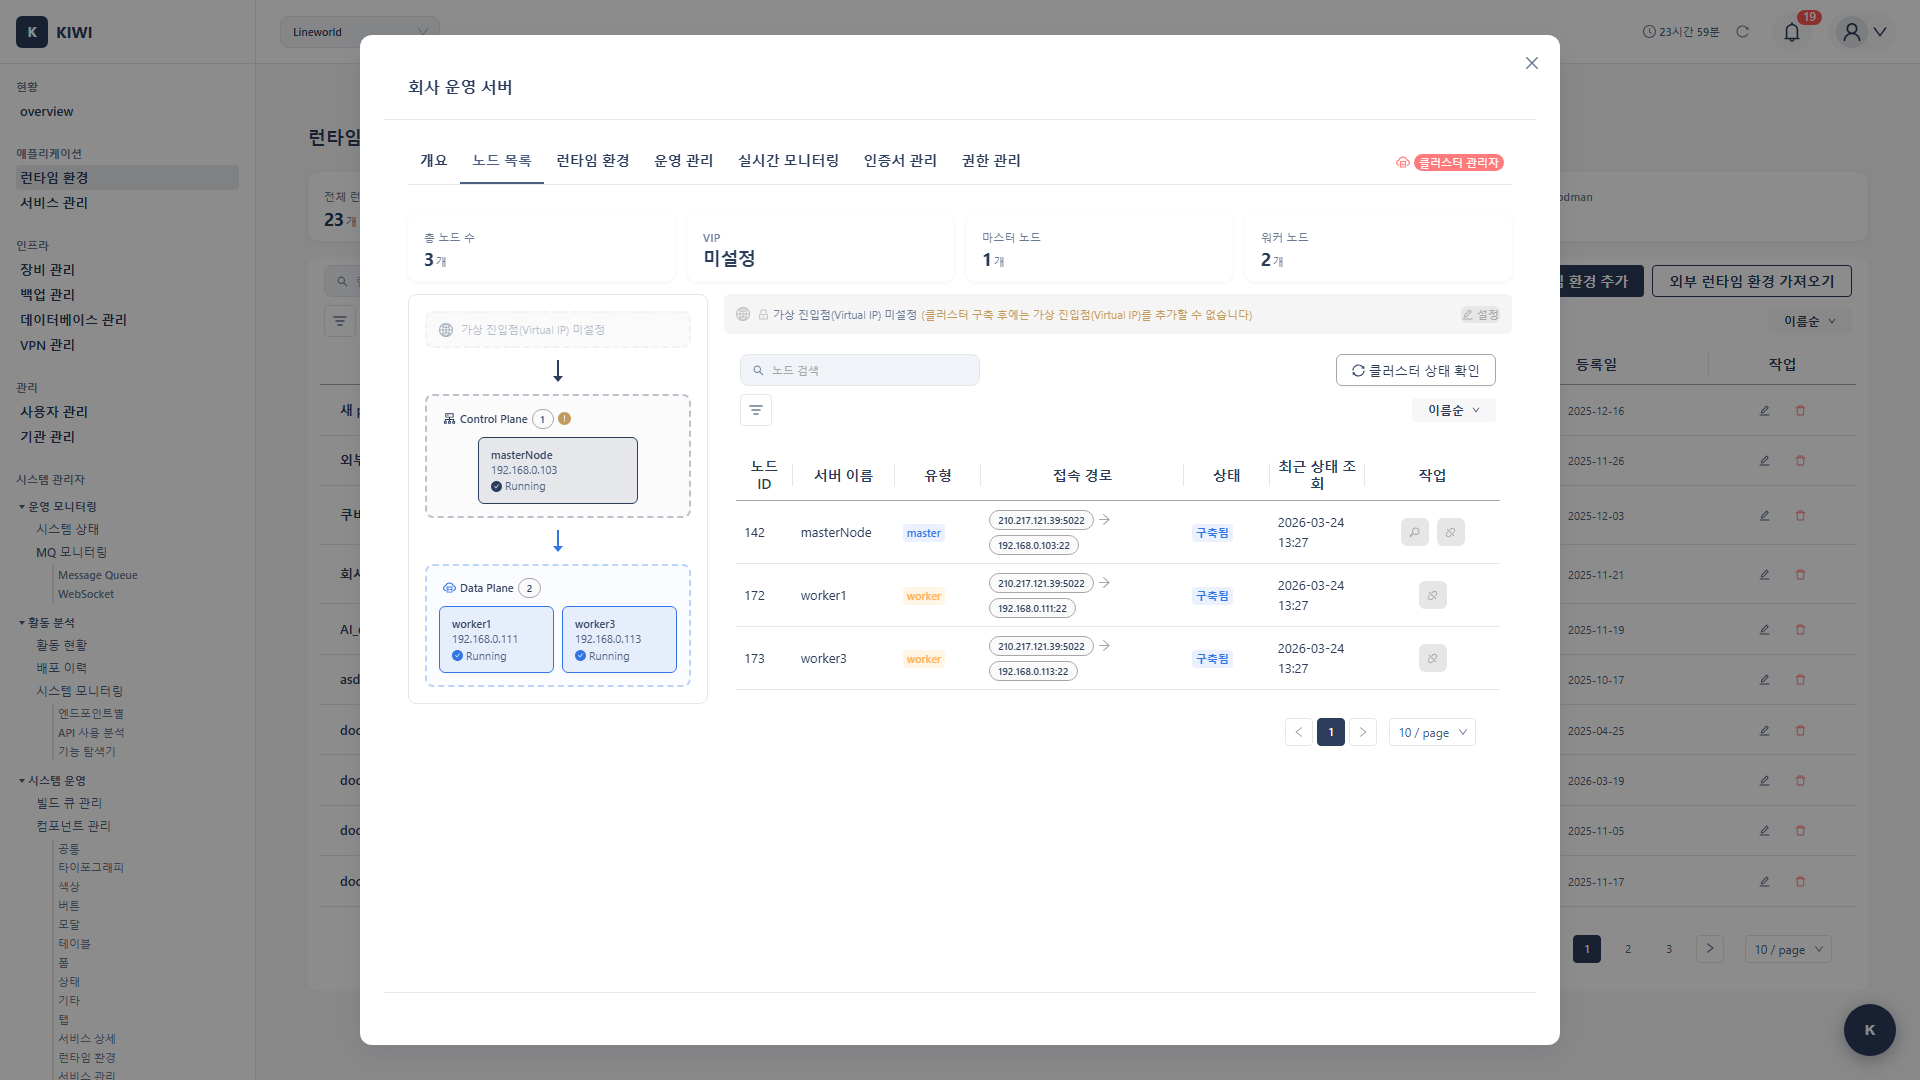
- Node List: View detailed status, IP, and resource usage of each node.
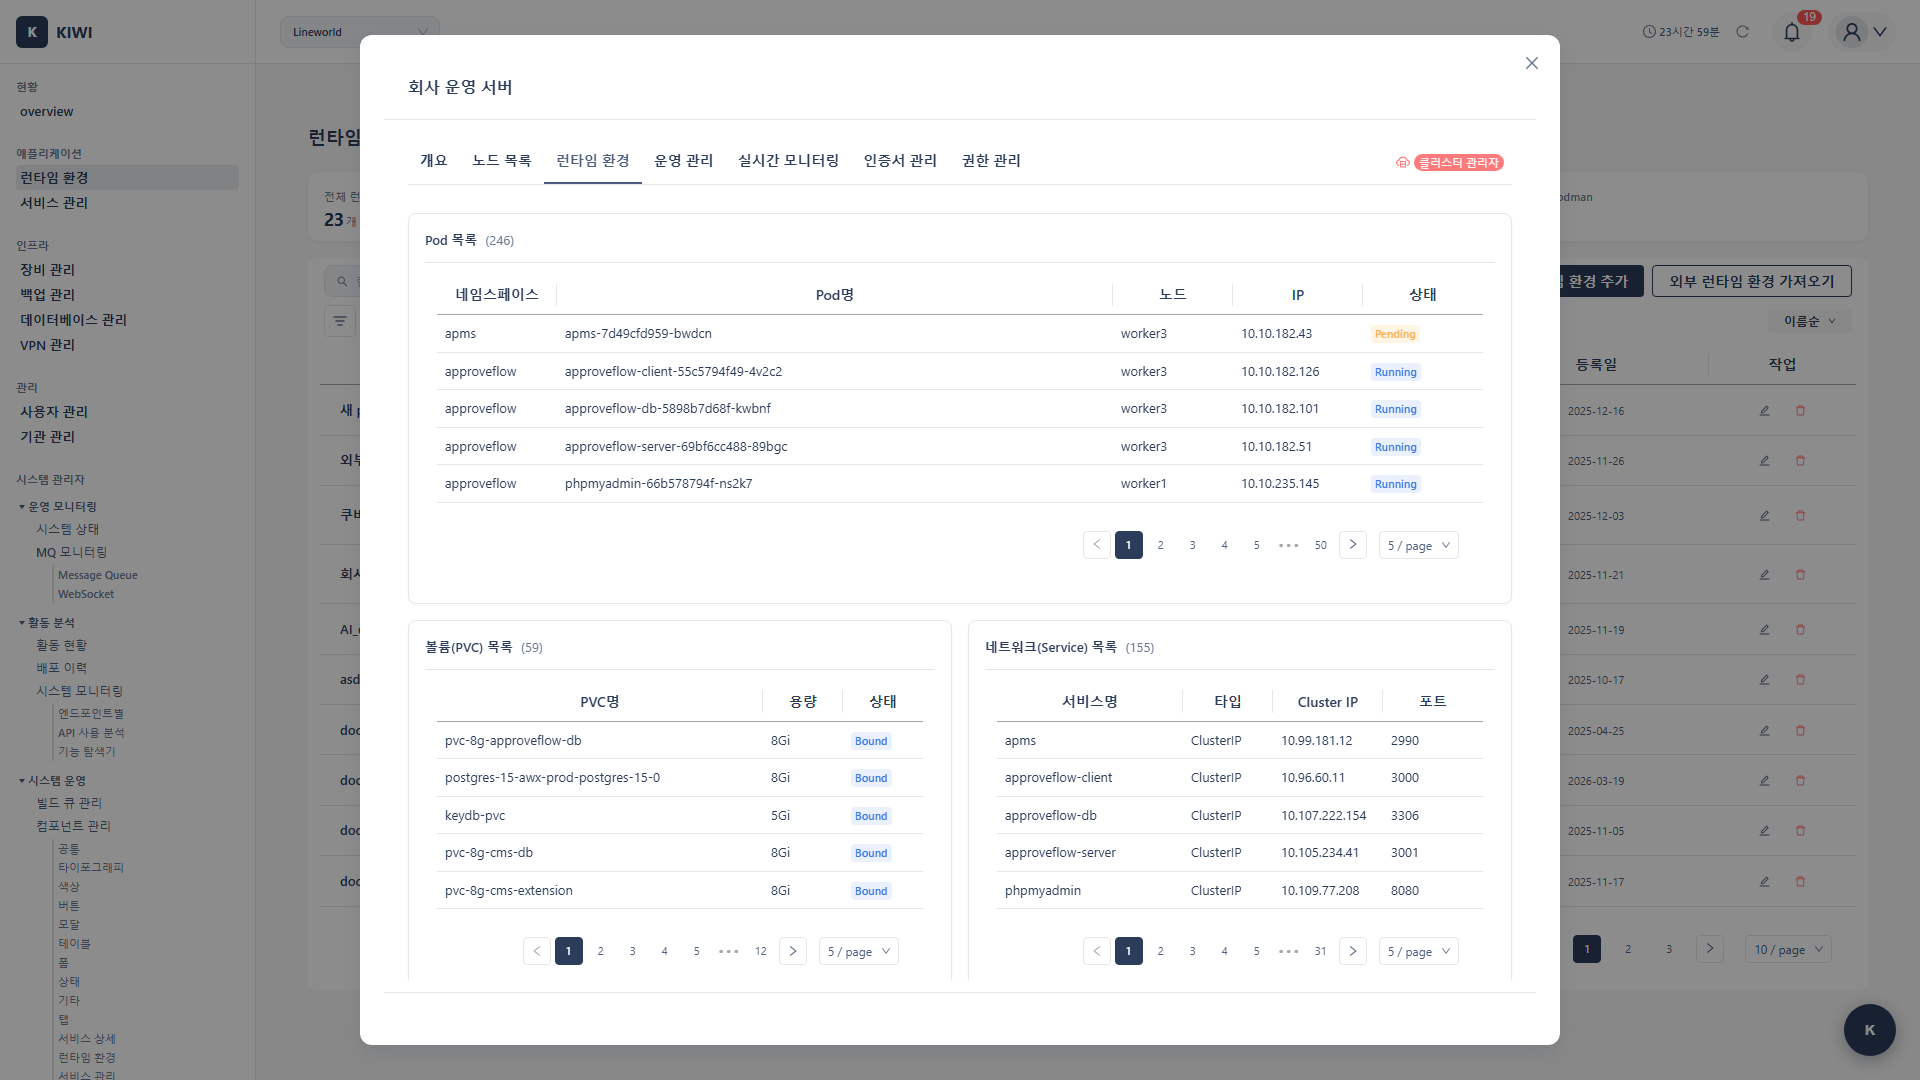
- Runtime Environment: View cluster version, settings, and configuration information.
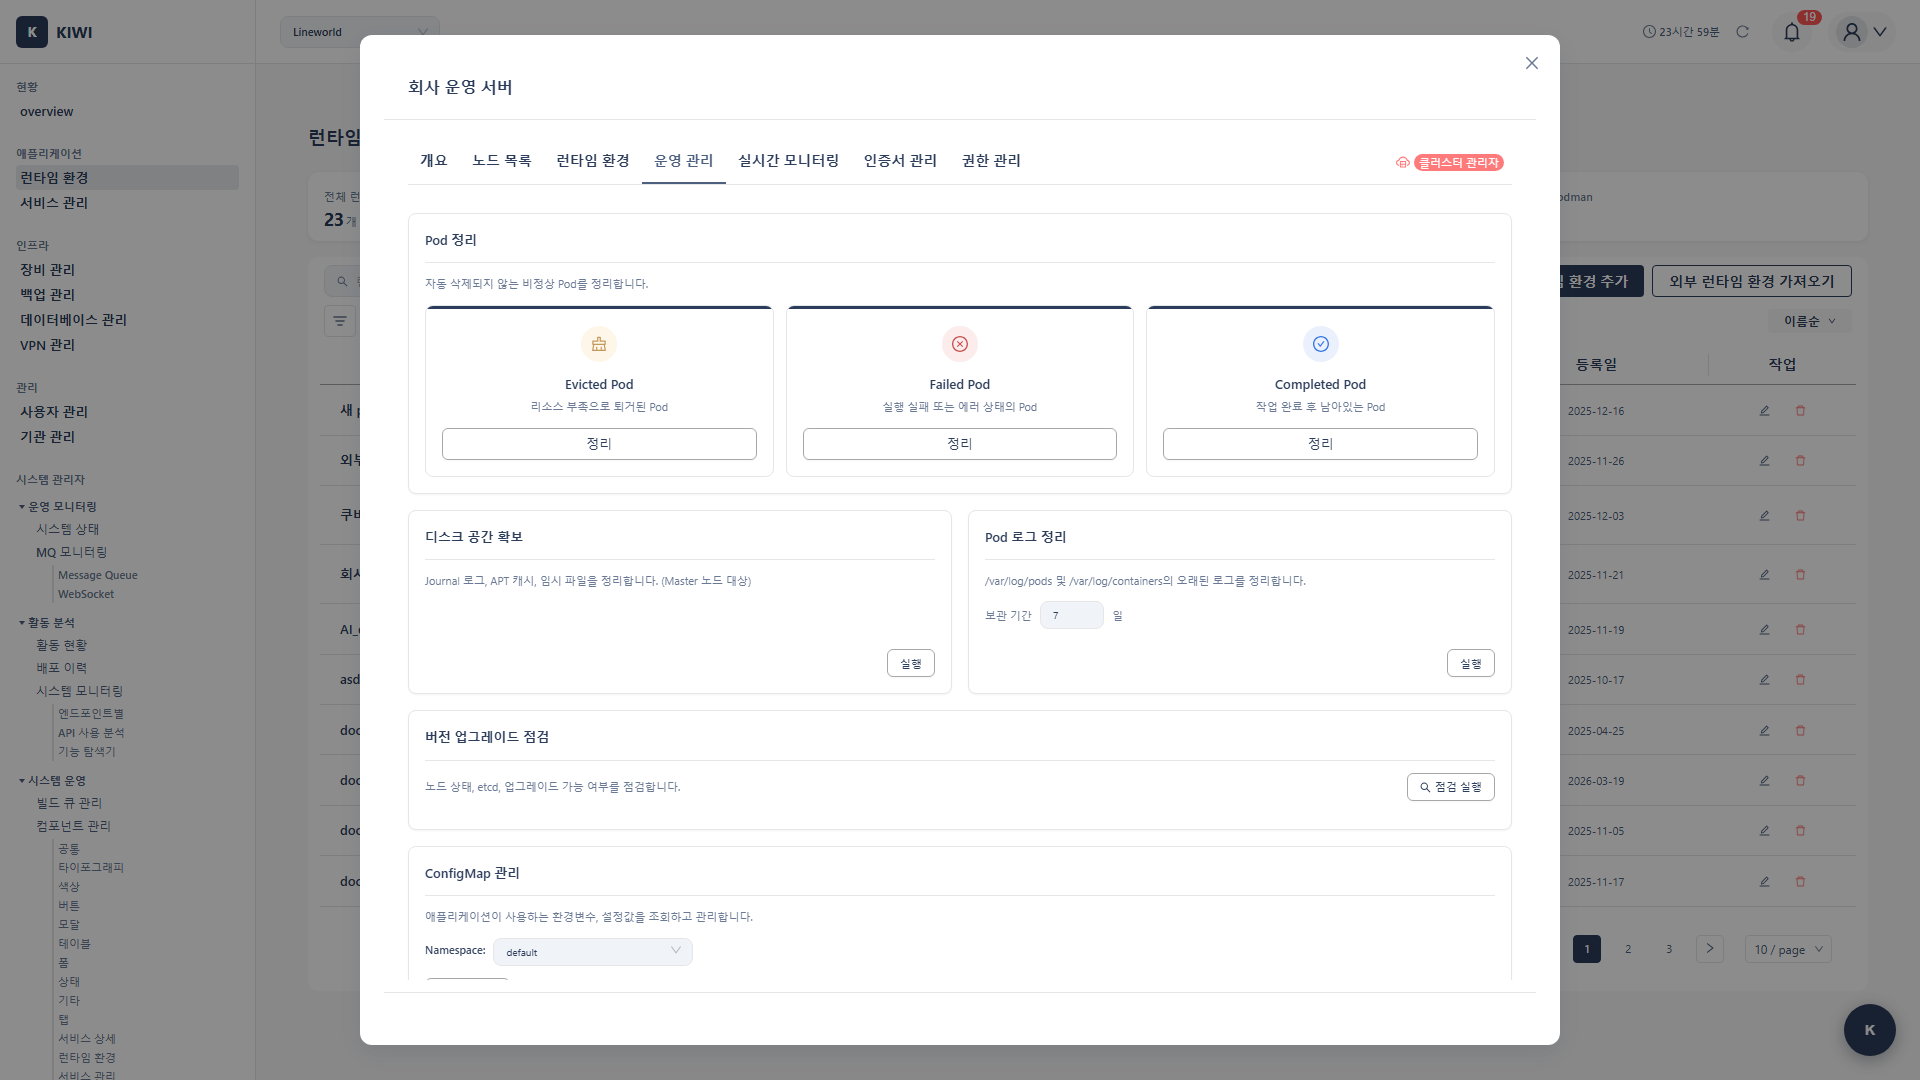
- Operations Management: Cluster operation tasks (upgrades, backups, etc.).
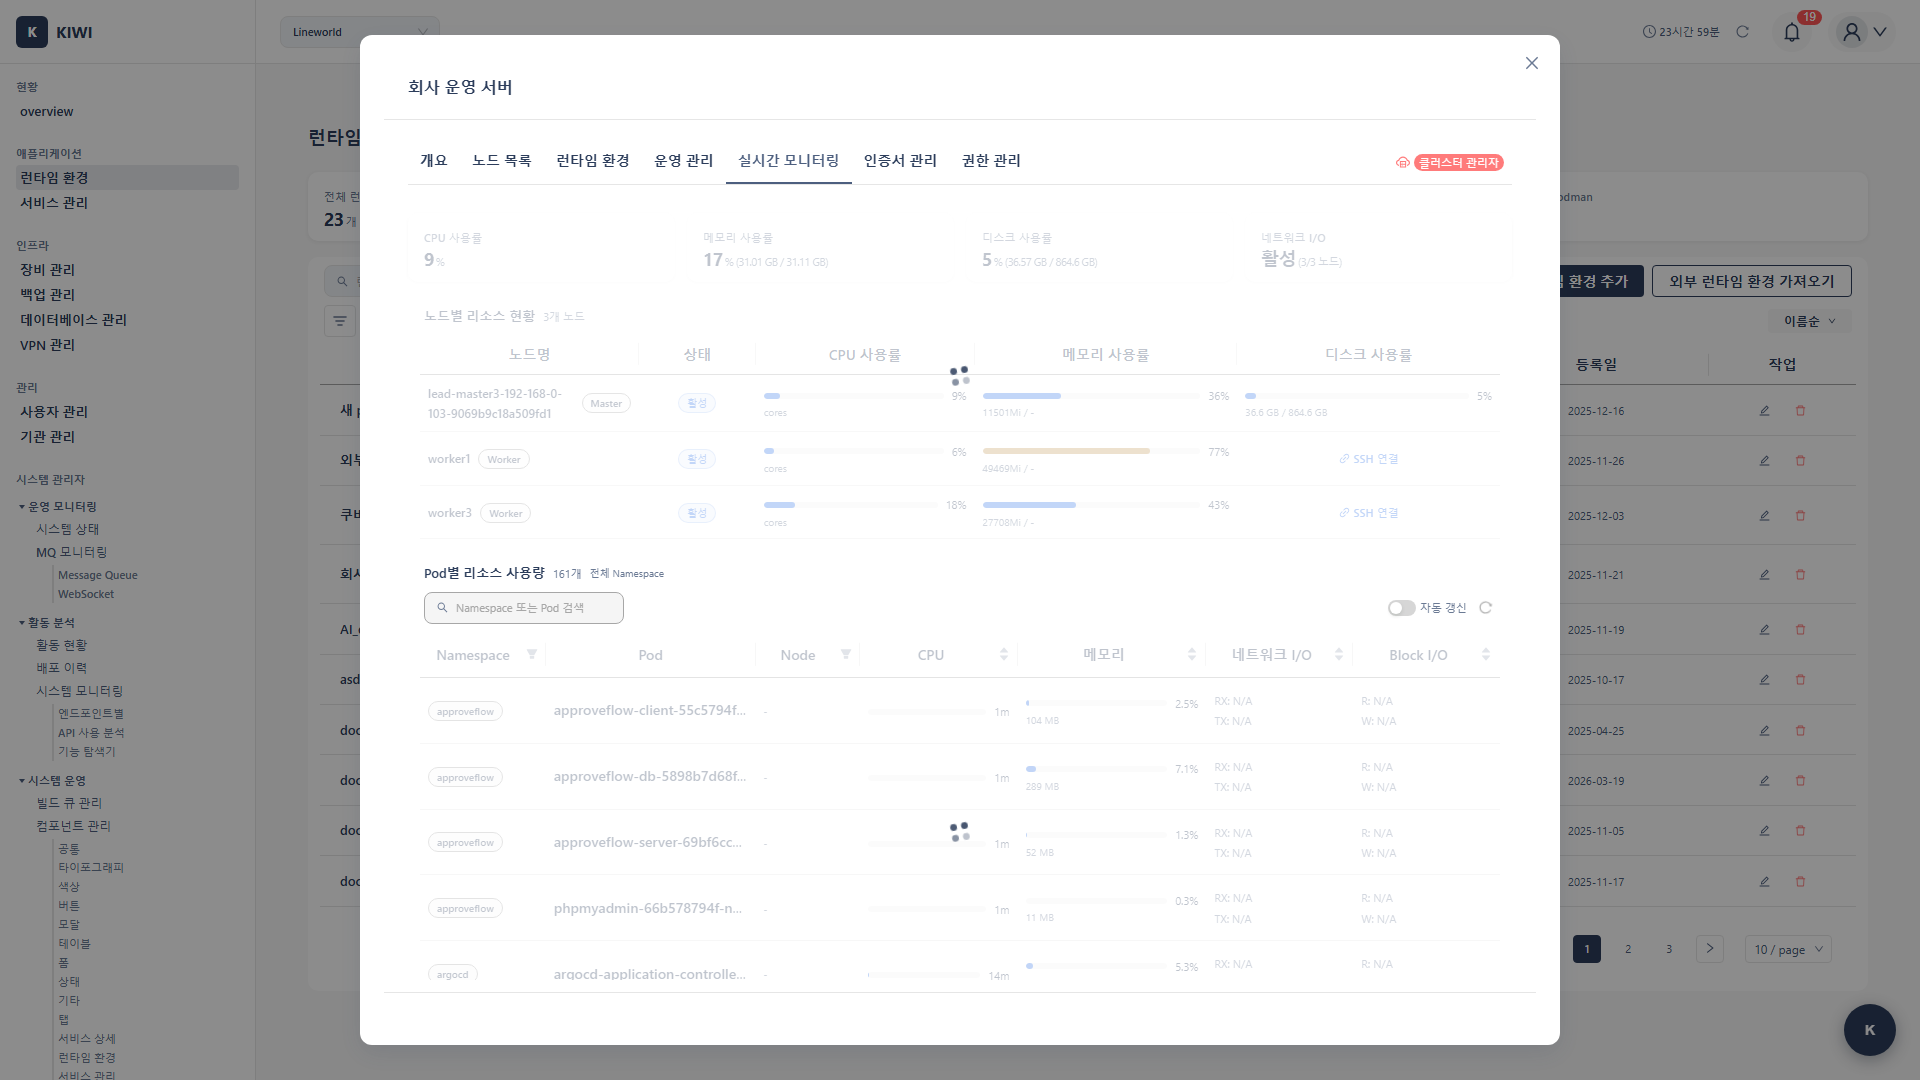
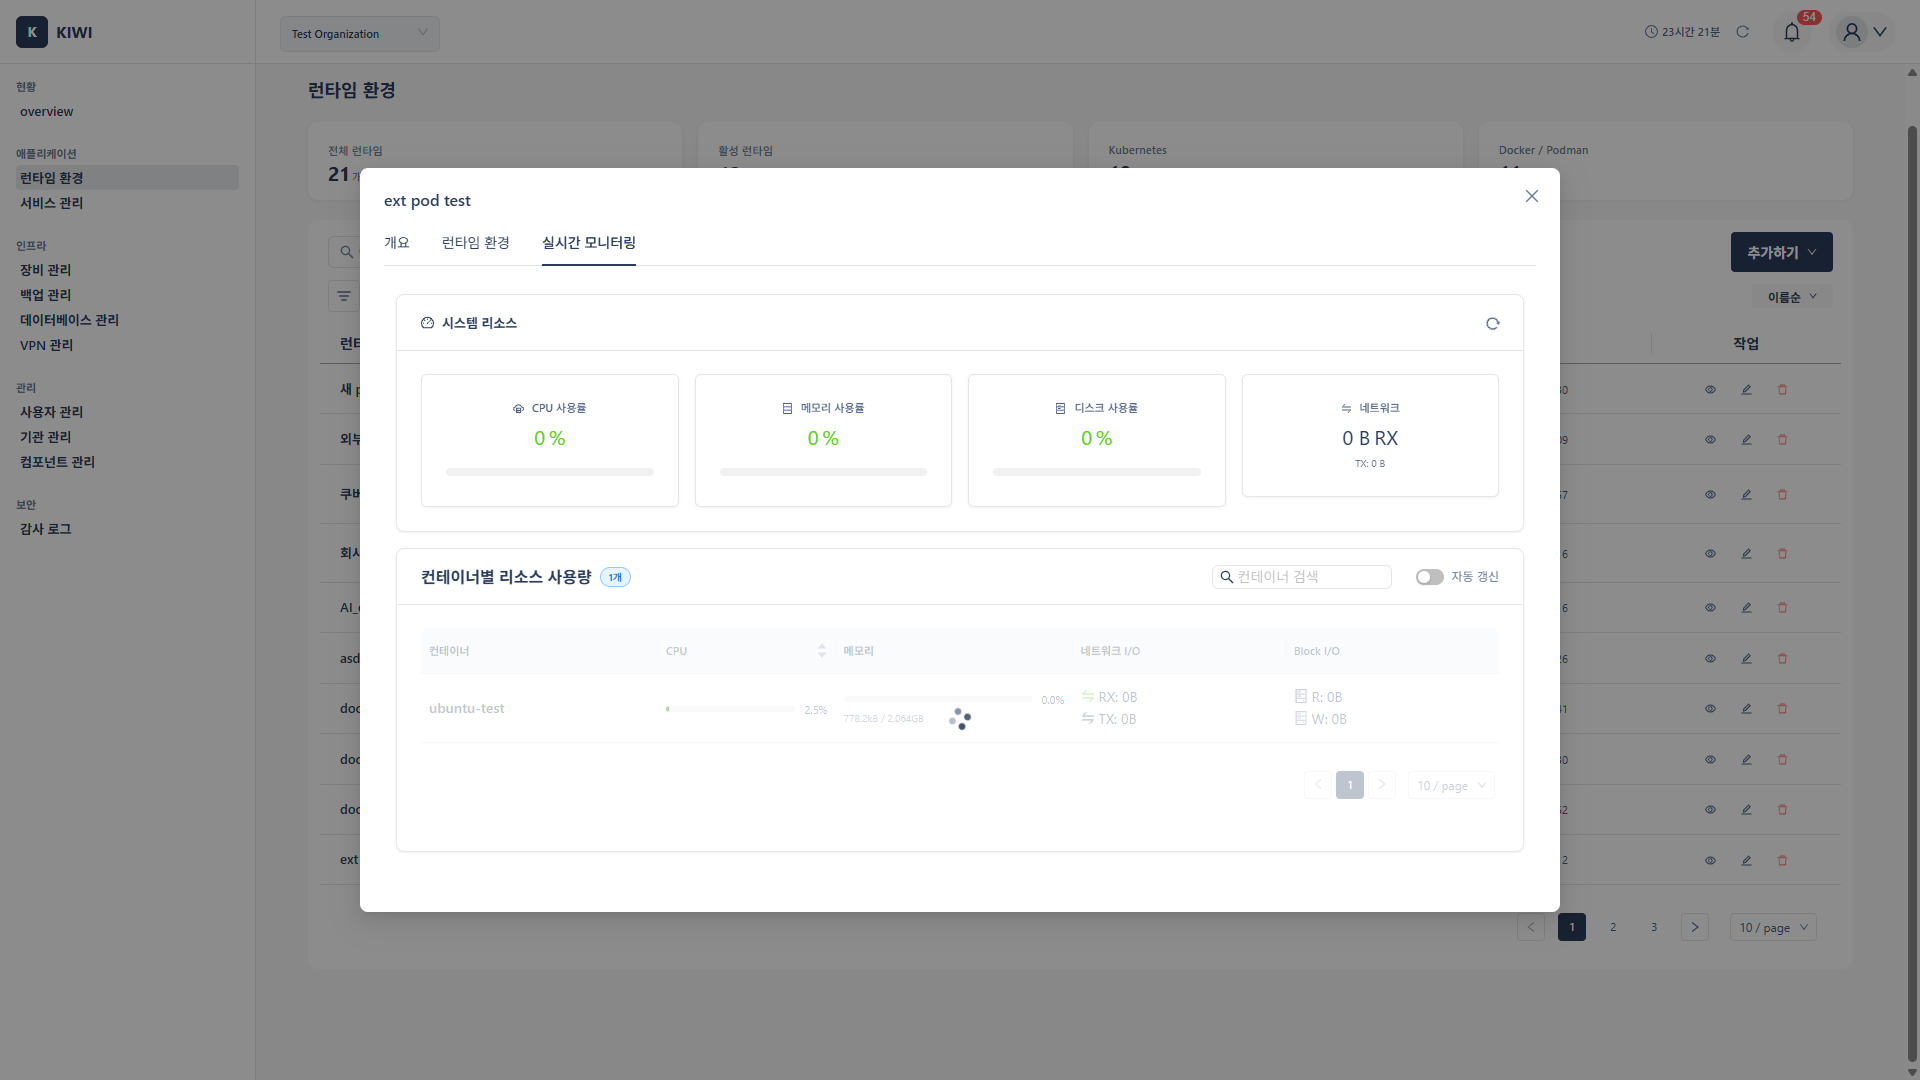
- Real-time Monitoring: Real-time graphs of CPU, memory, and other resource usage.
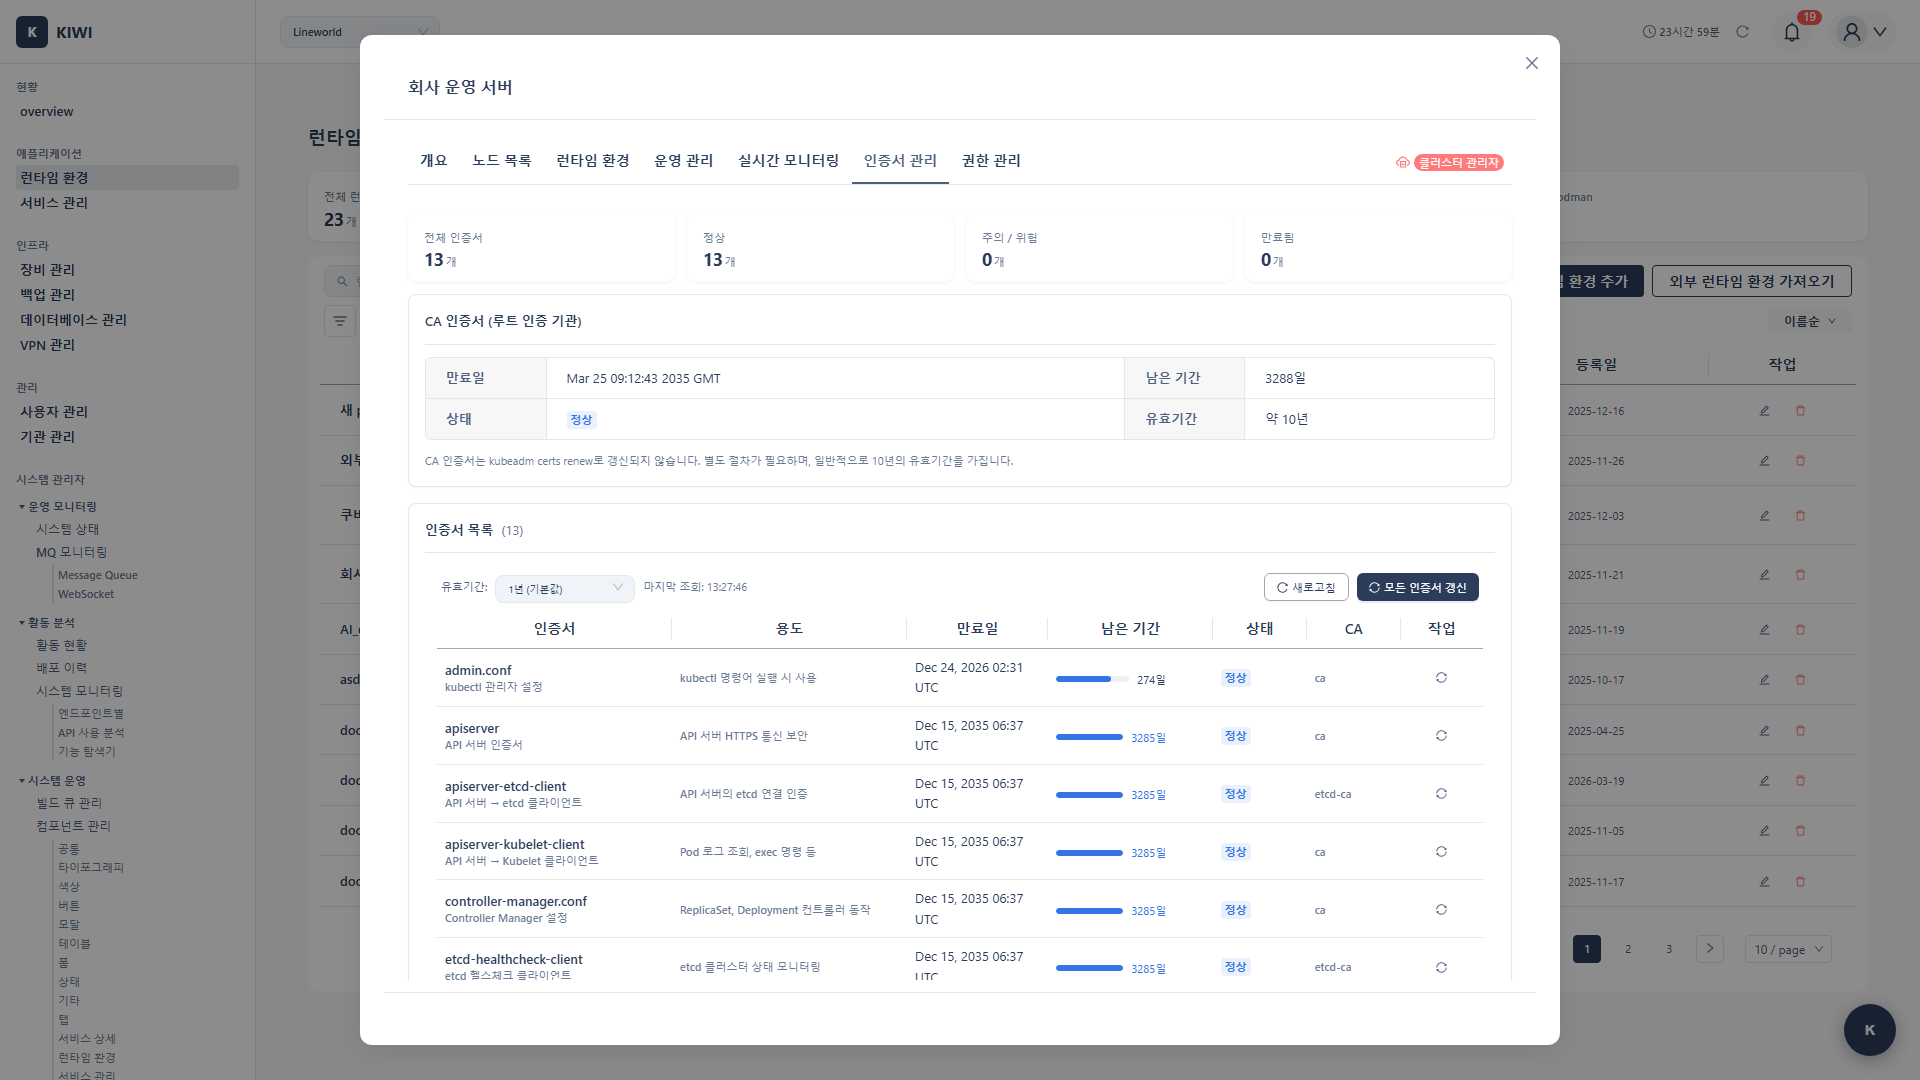
- Certificate Management: Check and renew cluster certificate status.
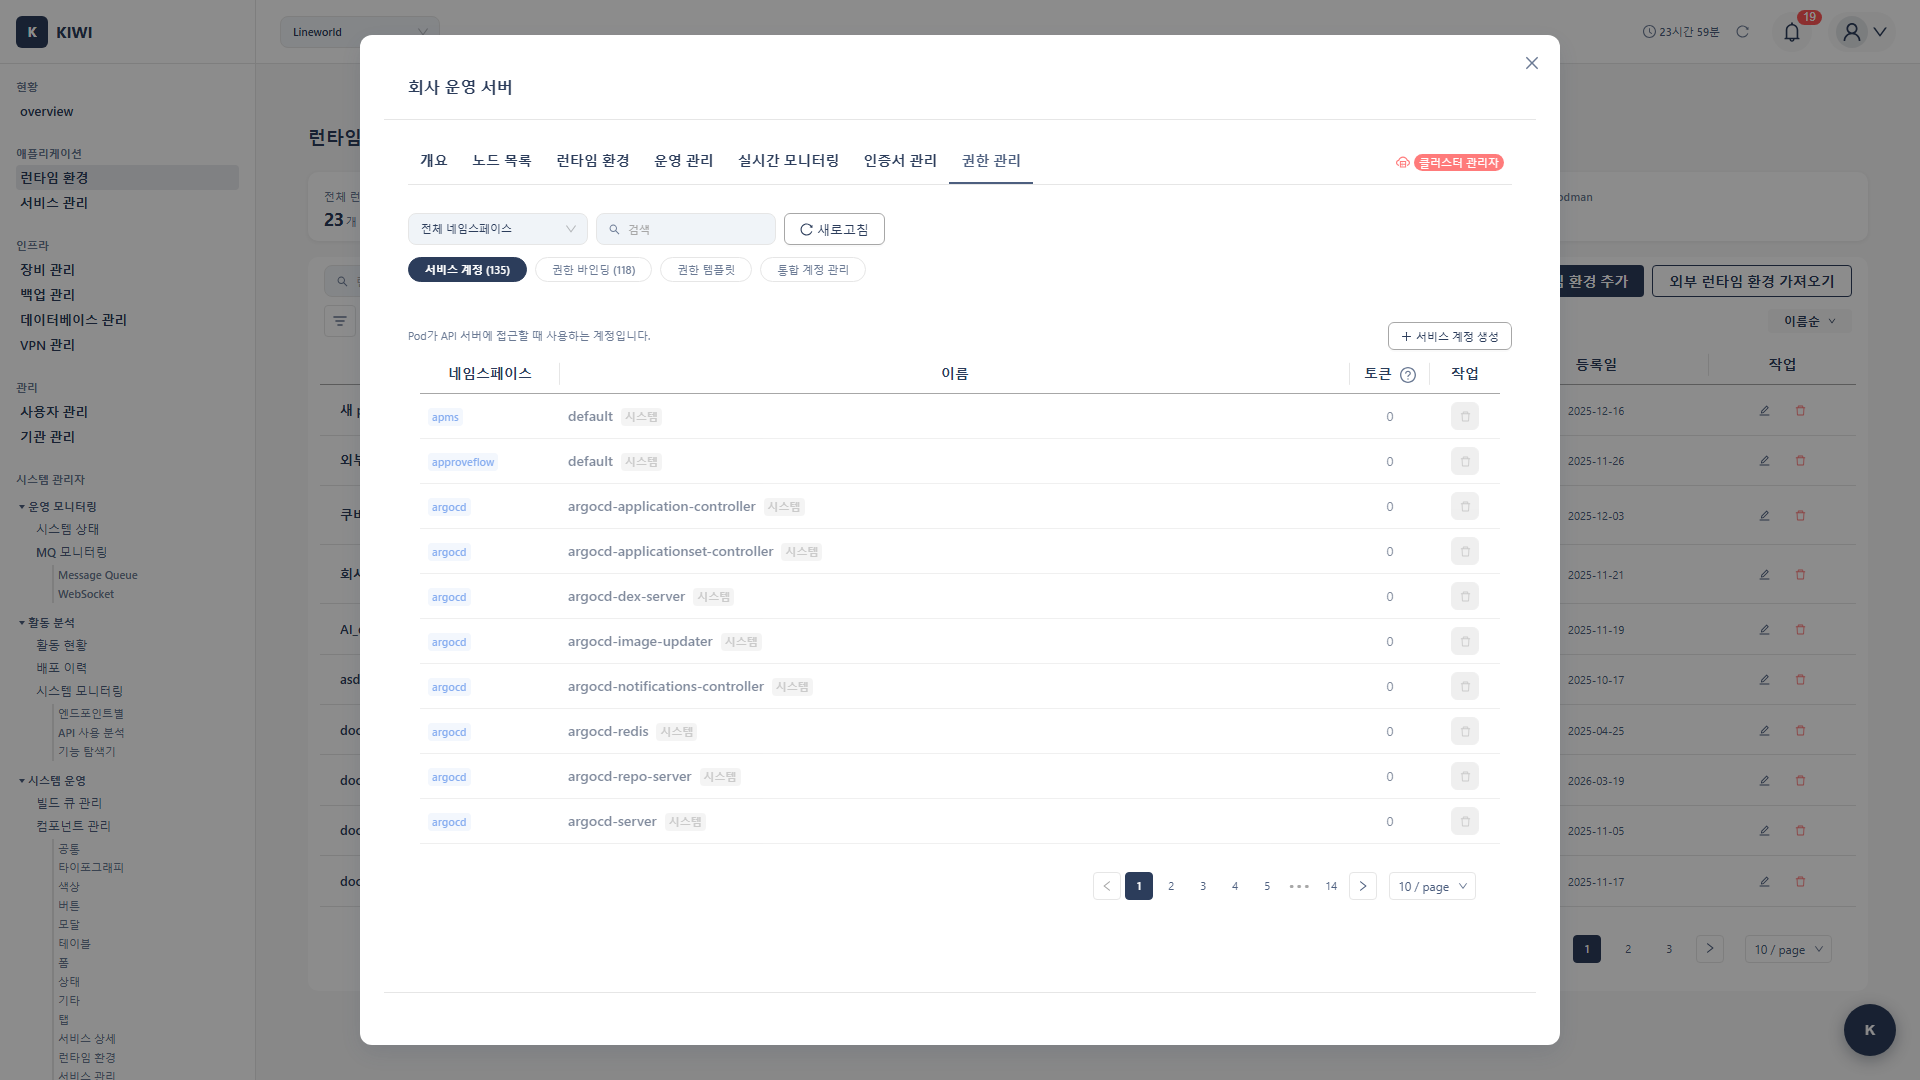
- Permission Management: RBAC settings, cluster access permission management.
Kubernetes Tab Screens
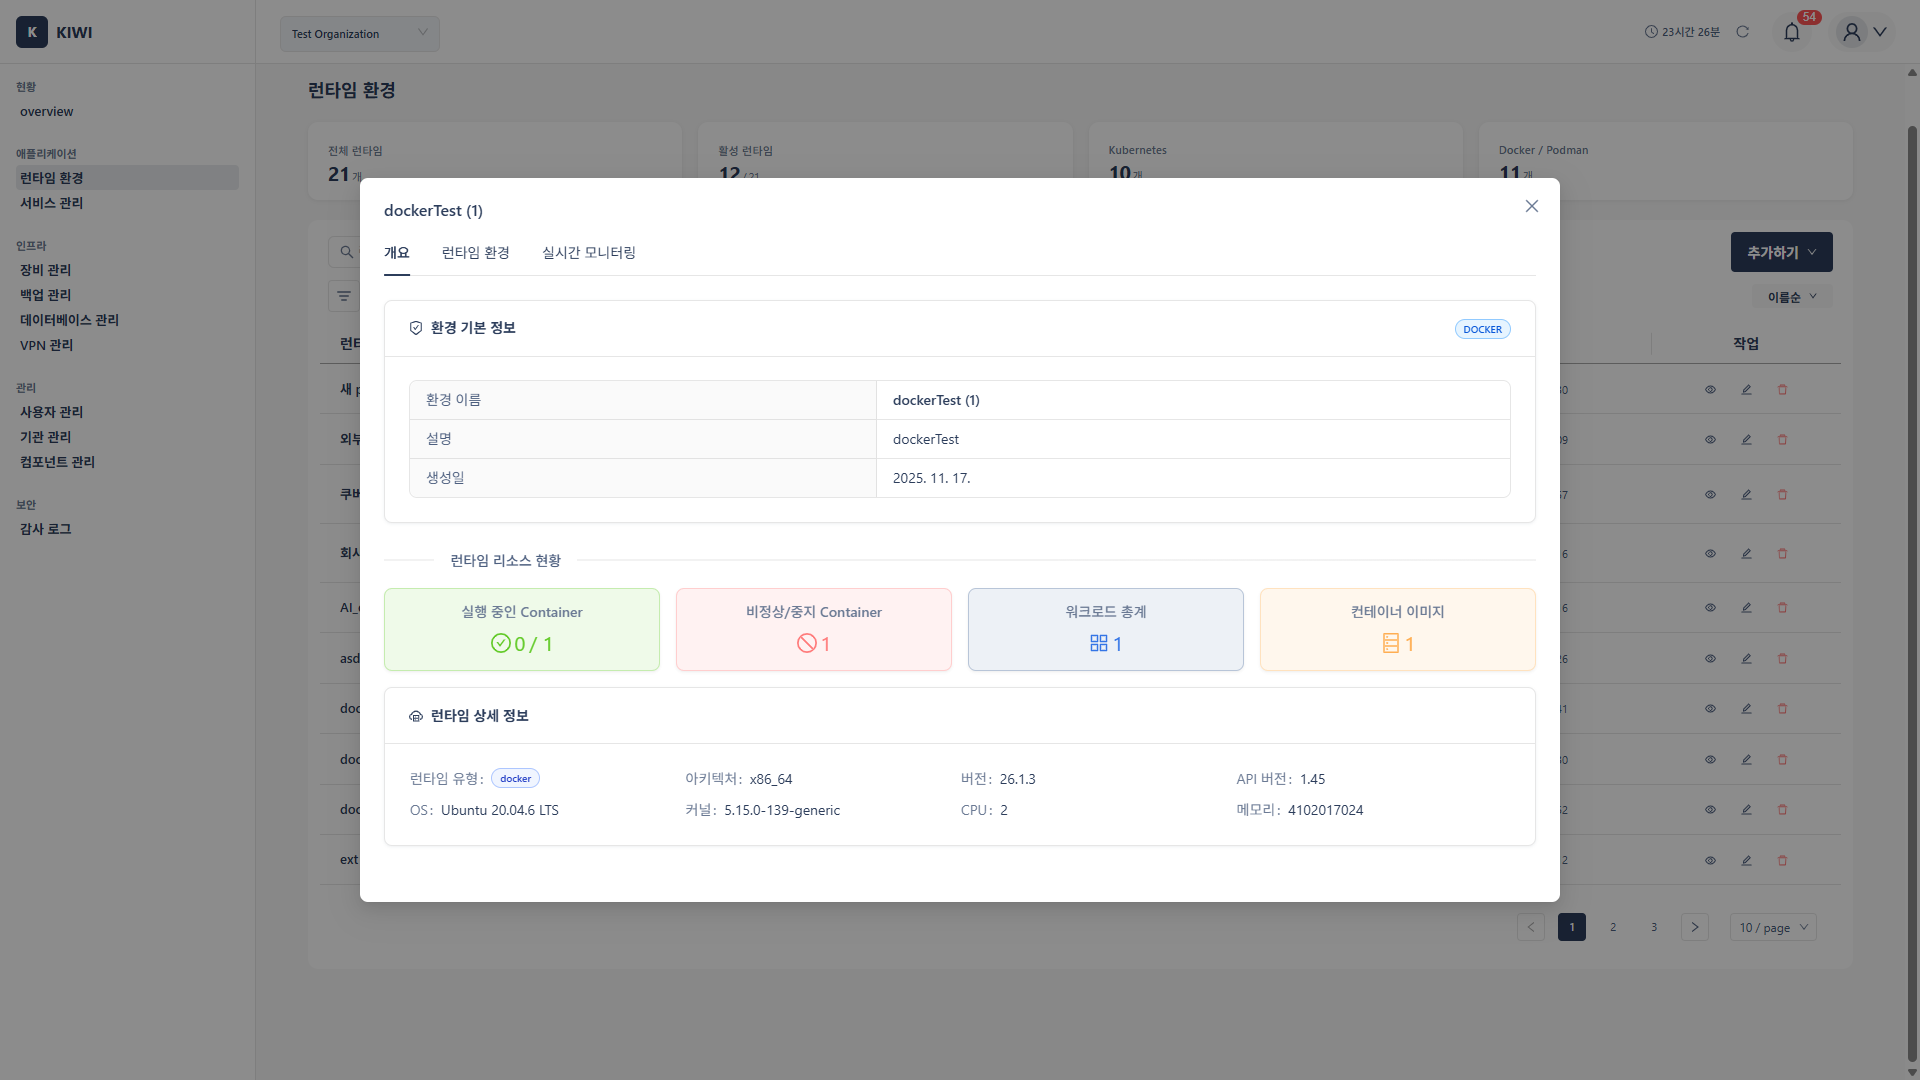
Docker/Podman Detail Page Tabs
Docker and Podman runtimes have a simpler tab structure.
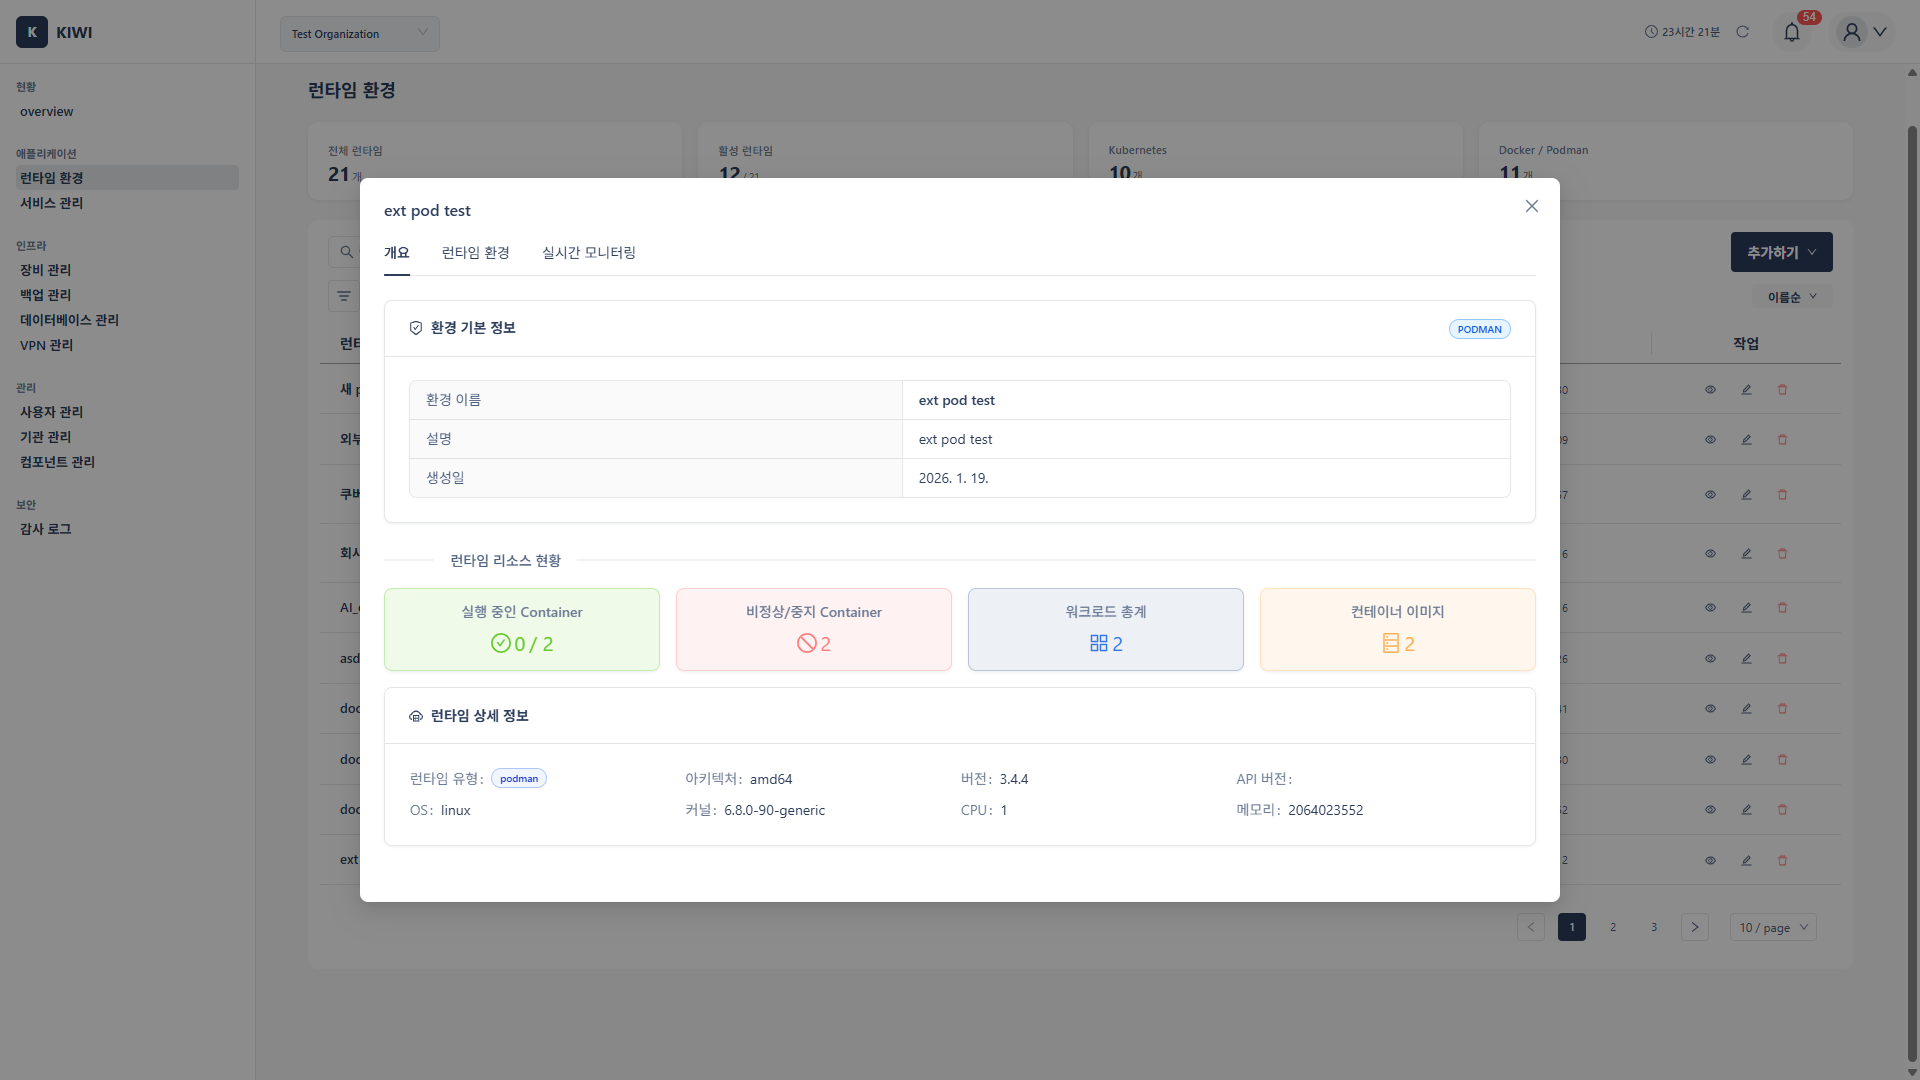
- Overview: View host status, number of running containers, and image count.
- Runtime Environment: View Docker/Podman version and configuration information.
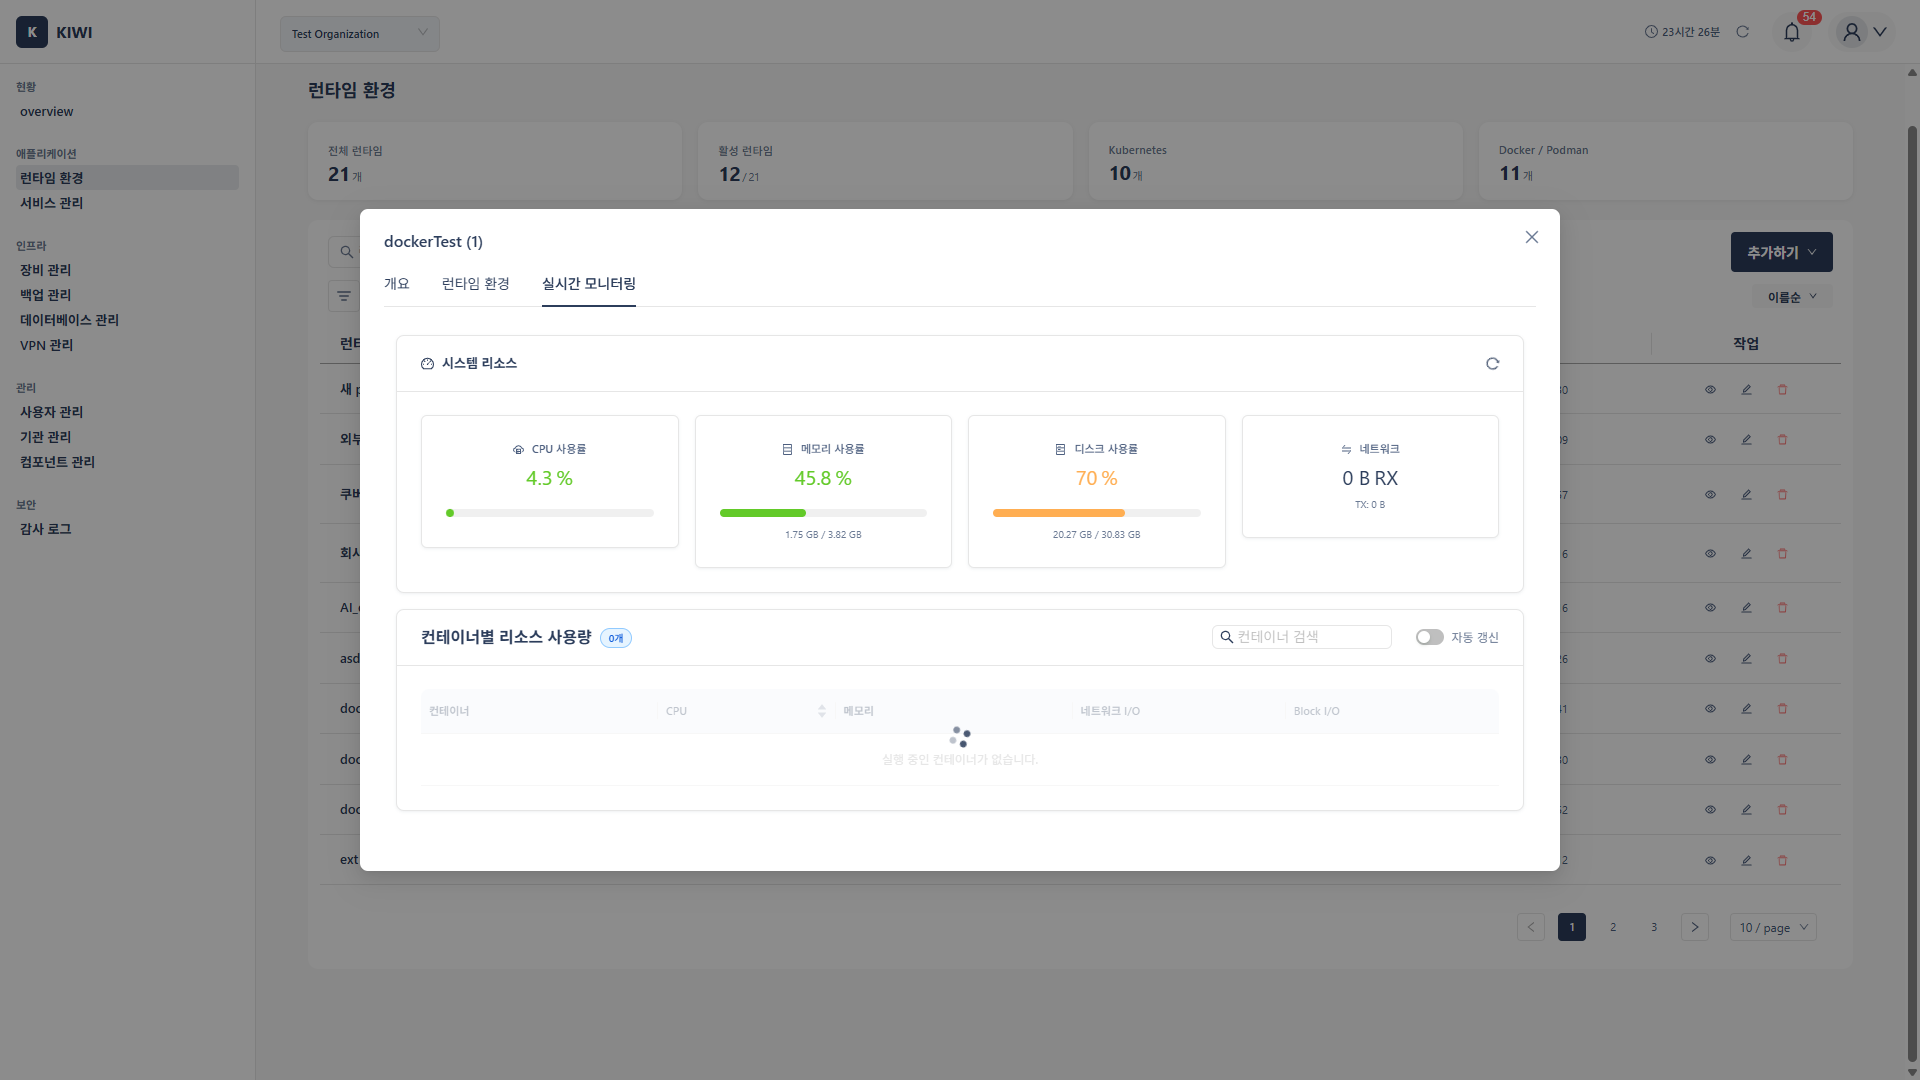
- Real-time Monitoring: Monitor resource usage per container.
Docker Tab Screens
Podman Tab Screens
How to Use
Registering a Kubernetes Cluster
Registering an Internal Cluster (KIWI-Managed)
This is for registering a cluster directly managed by KIWI. Kubernetes must be running on a server registered in Device Management.
- Click the Add Runtime button.
- Select Kubernetes as the type.
- Select Internal Cluster as the cluster type.
- Select the device where the master node is installed.
- The kubeconfig will be auto-detected. If not detected, manually enter the path (default:
~/.kube/config). - Click the Test Connection button to verify the connection.
- If the test succeeds, click the Save button.
Registering an External Cluster (Connecting Existing Cluster)
This is for connecting an already-built external cluster (e.g., AWS EKS, GCP GKE, self-built clusters).
- Click the Add Runtime button.
- Select Kubernetes as the type.
- Select External Cluster as the cluster type.
- Upload the kubeconfig file or paste its contents directly.
- If there are multiple contexts, select the context to use.
- Click the Test Connection button to verify the connection.
- If the test succeeds, click the Save button.
kubeconfig is a configuration file for connecting to a Kubernetes cluster. It contains the cluster address, authentication information, and context (which cluster to connect to as which user). It is typically located at ~/.kube/config.
The kubeconfig file contains authentication information for cluster access. If this file is leaked, unauthorized access to the cluster is possible, so manage it securely.
Registering a Docker Runtime
Register a host with Docker installed to KIWI.
- Click the Add Runtime button.
- Select Docker as the type.
- Select the host device where Docker is installed.
- Verify the Docker socket path.
- Default:
/var/run/docker.sock - For remote access:
tcp://192.168.1.100:2375format
- Default:
- Click the Test Connection button to verify the connection.
- If the test succeeds, click the Save button.
A Docker socket is an interface for communicating with the Docker daemon (background service). KIWI sends commands to Docker through this socket.
Registering a Podman Runtime
The Podman registration process is similar to Docker.
- Click the Add Runtime button.
- Select Podman as the type.
- Select the host device where Podman is installed.
- Verify the Podman socket path (default:
/run/podman/podman.sock). - Click Test Connection then Save.
Installing the Metrics Server (Kubernetes)
The Metrics Server collects resource usage from your Kubernetes cluster. It must be installed to use HPA (auto-scaling) or the kubectl top command.
- Navigate to the Kubernetes runtime detail page.
- Select the Real-time Monitoring tab.
- Click the Install Metrics Server button.
- Review the installation options:
- Version: Latest stable version recommended.
- TLS Certificate Verification: Disable for self-signed certificate environments.
- Click the Install button.
- Once installation is complete, resource usage graphs will be displayed.
Without the Metrics Server, resource monitoring is limited. We recommend installing the Metrics Server first after registering a Kubernetes cluster.
Quick Access to Common Features
- Change runtime settings: Runtime list → Click the gear icon for the target runtime.
- Connect external Kubernetes: Add Runtime → Kubernetes → Select External Cluster.
- Install Metrics Server: Kubernetes detail → Real-time Monitoring tab → Install Metrics Server.
- Install I/O Monitoring: Kubernetes detail → Real-time Monitoring tab → Install I/O Monitoring (cAdvisor or Prometheus Stack).
- Renew certificates: Kubernetes detail → Certificate Management tab → Renew target certificate.
Glossary
- Node: An individual server (worker machine) that comprises a Kubernetes cluster.
- Master Node: A node running the Control Plane of a Kubernetes cluster. Manages the entire cluster.
- kubeconfig: A configuration file containing Kubernetes cluster connection information.
- Context: A combination of cluster, user, and namespace settings within kubeconfig. Useful when working with multiple clusters.
- Docker Socket: An interface for communicating with the Docker daemon (Unix socket or TCP socket).
- Volume: Storage for persistently storing container data. Data persists even when containers are deleted.
- HPA: Horizontal Pod Autoscaler. A feature that automatically scales Pod count up or down based on load.
- RBAC: Role-Based Access Control. A method of managing cluster access permissions based on roles.
Troubleshooting and Precautions
- Kubernetes: Network access to the API server (default port 6443) must be available. Check your firewall settings.
- Docker/Podman: Read/write permissions to the socket file are required.
Common Issues
- Connection test fails: Check network connectivity, firewall settings, and authentication information.
- Resource usage not displayed: For Kubernetes, verify that the Metrics Server is installed.
- Certificate expiration warning: For external clusters, periodically check certificate expiration dates and renew before expiration.
- Check certificate expiration dates monthly.
- Monitor resource usage trends for capacity planning.
- Clean up unused runtimes to reduce management overhead