Monitoring Extension Installation
Is Metrics Server not enough? If you need to analyze historical data, set up alerts, or get more detailed metrics, install the monitoring extensions. Prometheus and cAdvisor let you build a professional monitoring environment.
- When you want to analyze resource usage trends compared to last week
- When you want Slack alerts when CPU exceeds 80%
- When you need to check network usage per Container.
Monitoring Components
Metrics Server vs Monitoring Extensions
Let's compare the role and characteristics of each tool.
-
Metrics Server: Provides basic resource metrics with real-time data only. Used for HPA and
kubectl topcommands. -
cAdvisor: Provides detailed per-Container metrics with real-time data only. Used for detailed monitoring of container resources.
-
Prometheus: Collects, stores, and queries metrics with long-term storage capability. Used for trend analysis and alerting.
- If you only need HPA: Install Metrics Server only.
- If you need detailed monitoring: Install Metrics Server + cAdvisor
- If you need historical analysis and alerts: Install all
Recommended Installation Order
Installing step by step makes it easier to identify issues if problems occur.
- Metrics Server (Required): Foundation for HPA and
kubectl topcommands. - cAdvisor (Recommended): Collects detailed per-Container metrics.
- Prometheus (Optional): Install when you need long-term data storage and alerts.
Prerequisites
- A Kubernetes cluster must be registered in KIWI
- Administrator access to the cluster is required.
- Sufficient cluster resources (for Prometheus installation)
Permission Notice: If you cannot access this feature, please request permission from your organization manager.
cAdvisor Installation
cAdvisor collects container resource usage on each node.
Step 1: Navigate to Monitoring Tab
- Select the target cluster from the [Runtime Environment] page
- Click the Monitoring tab on the cluster detail page
Step 2: Pre-flight Check
- Click the Monitoring Extension button.
- Pre-flight check runs automatically:
- Cluster connection status
- Node accessibility
- Existing installation status
Step 3: Install cAdvisor
- Select the Install cAdvisor option.
- Review installation options:
- Port: Default 8080
- Resource Limits: CPU/memory limit settings.
- Click the Install button.
Step 4: Verify Installation
When installation is complete:
- cAdvisor DaemonSet is deployed to each node.
- cAdvisor Status: Shows Running.
- Container metrics are collected per node.
Prometheus Installation
Prometheus collects and retains metrics long-term.
Step 1: Select Prometheus Installation
- Select Install Prometheus in the Monitoring Extension modal.
- Configure installation options.
Step 2: Storage Settings
Prometheus requires storage to store metric data:
- EmptyDir (Recommended for test environments): Temporary storage where all data is lost when the Pod restarts. Use only for quick testing or demos.
- PVC (Recommended for production environments): Persistent storage using PersistentVolumeClaim. Data is retained even when Pod restarts, and is essential for production environments. StorageClass and PV must be pre-configured.
- External Storage (Recommended for large-scale environments): Integration with external storage systems like Thanos or Cortex. Suitable for large-scale environments requiring high-capacity data storage and high availability.
Step 3: Resource Settings
Configure Prometheus resource requests:
- CPU: Minimum 250m required, generally 500m recommended. For large clusters (20+ nodes), allocate 1000m (1 CPU) or more.
- Memory: Minimum 512Mi required, 1Gi recommended. If memory is insufficient, the Pod restarts due to OOM (Out of Memory), so allocate 2Gi or more for large environments.
- Storage: Determined by retention period and collection targets. Minimum 10Gi, recommended 50Gi, and secure 100Gi or more for large environments requiring long-term retention.
Step 4: Retention Period Settings
Configure the metric data retention period:
- 15 days (Default): For short-term analysis.
- 30 days: Monthly trend analysis.
- 90 days: Quarterly analysis.
- 365 days: Annual analysis (requires large storage)
Step 5: Execute Installation
- Review settings and click the Install button.
- Installation progress is displayed:
- Install Prometheus Operator
- Create Prometheus instance
- Configure ServiceMonitor
- Confirm the installation completion message
Check Installation Status
Status Display
You can check the status of each component in the Monitoring tab:
- Not Installed: The monitoring component has not been installed yet. Click the install button to start installation.
- Installing: Installation is in progress. Please wait until it completes. Typically takes 1-3 minutes.
- Running: The component is operating normally. Metric collection is in progress, and you can view data in the dashboard.
- Error: An error occurred with the component. Check logs to diagnose the issue and try reinstalling if necessary.
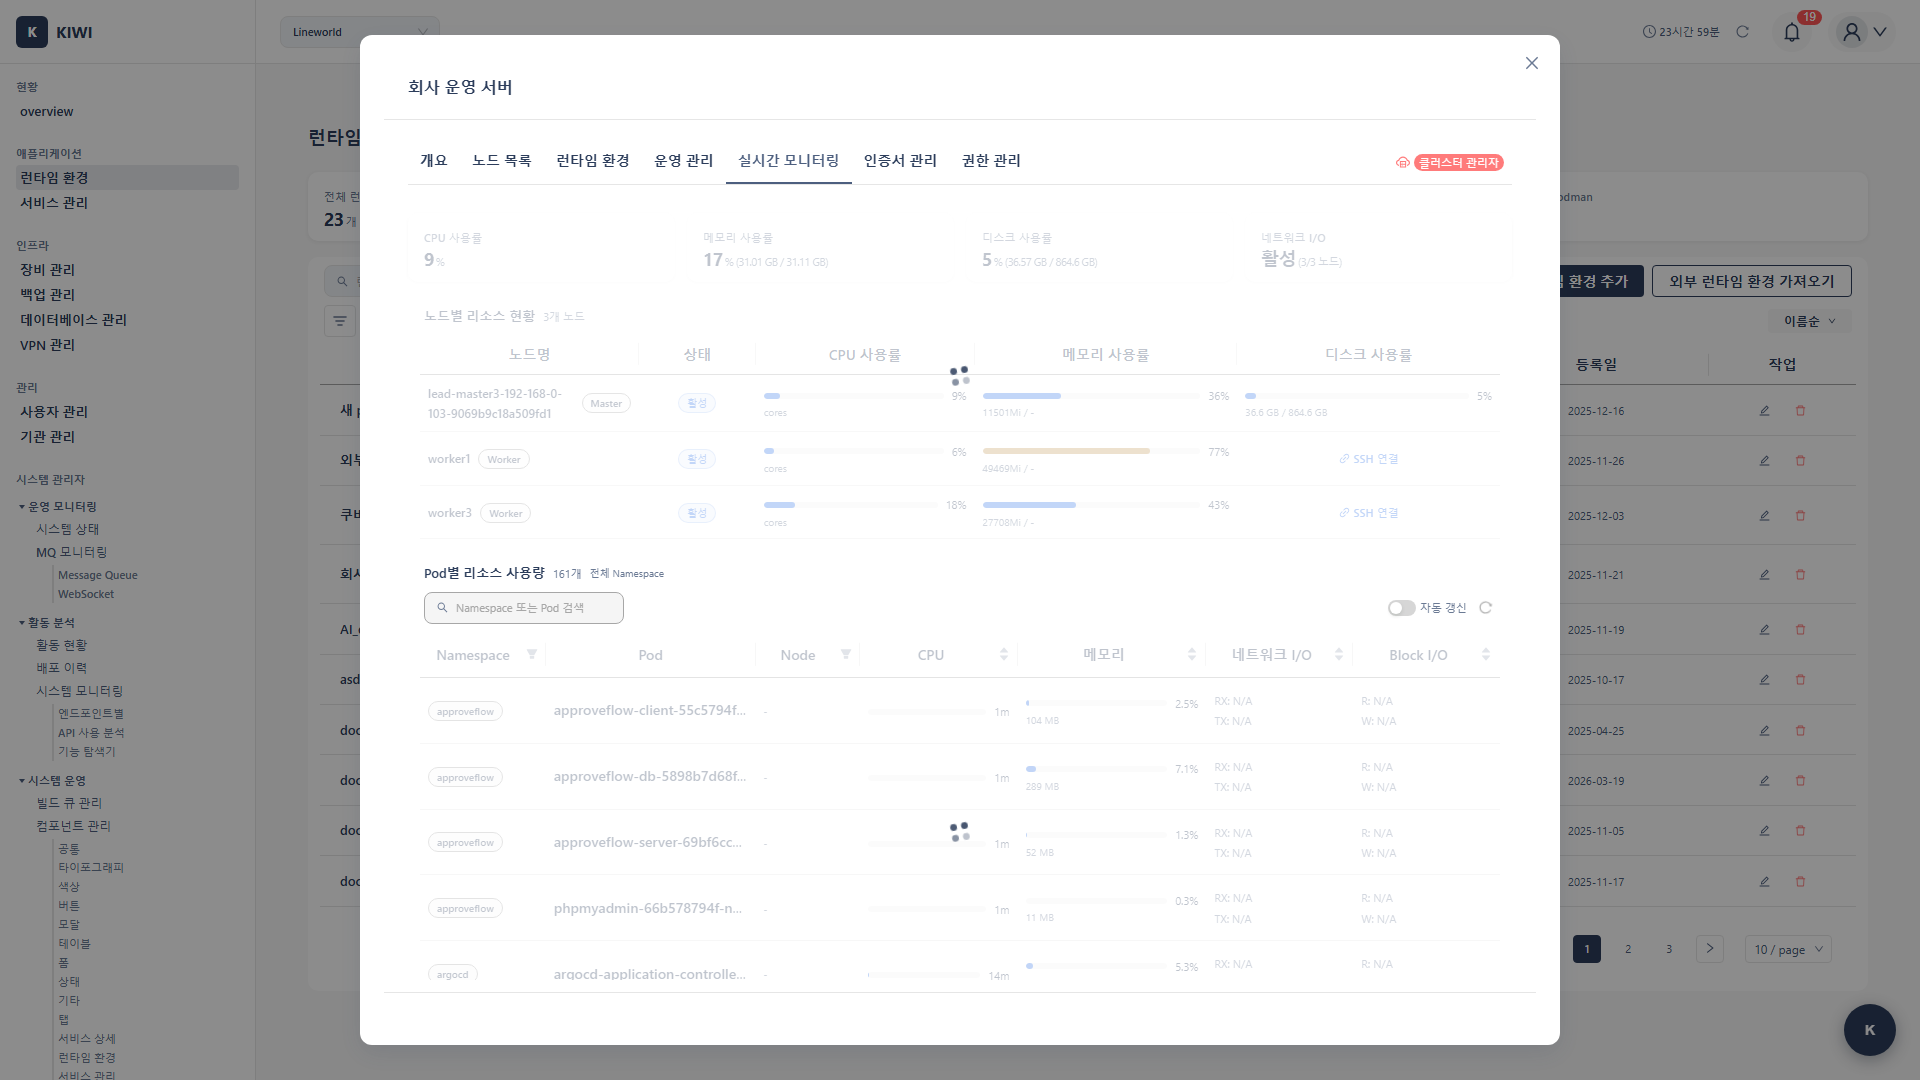
Real-time Metric Verification
Metrics available in KIWI after installation:
Node Level:
- CPU usage (%)
- Memory usage (GB / %)
- Disk usage
- Network I/O
Pod Level:
- Per-container CPU usage
- Per-container memory usage
- Restart count
Cluster Level:
- Total resource capacity
- Allocated resources
- Available resources
Usage in KIWI Dashboard
Dashboard Widgets
Widgets added to the dashboard after monitoring extension installation:
- Cluster Resource Status: CPU/memory usage gauges.
- Node Status: Per-node resource usage charts.
- Pod Resources: Top resource-consuming Pod list
- Trend Charts: Time-based resource usage graphs.
Usage in Service Operations
Check real-time resources in the service operations modal:
- Click Operations button in the service list
- Select the Resources tab
- Check real-time CPU/memory usage
- View history graphs (when Prometheus is installed)
Alert Settings (Prometheus)
You can configure alerting rules when Prometheus is installed.
Default Alert Rules
KIWI provides the following default alert rules:
- HighCPUUsage (Warning): Triggers when CPU usage exceeds 80% for more than 5 minutes. Performance degradation is expected, so consider resource scaling or optimization.
- HighMemoryUsage (Warning): Triggers when memory usage exceeds 85% for more than 5 minutes. There's risk of OOM, so consider checking for memory leaks or increasing resources.
- PodCrashLooping (Critical): Triggers when a Pod restarts 5 or more times within 1 hour. There's an application error or configuration issue, so check logs immediately.
- NodeNotReady (Critical): Triggers when a node enters NotReady state. Pods cannot be scheduled on that node, so check node status immediately.
Alert Notification Settings
- Click Alert Settings button in the Monitoring tab
- Select notification method:
- Slack: Enter Webhook URL
- Email: Enter recipient email
- Webhook: Custom Webhook URL
- Click Save button.
Troubleshooting
cAdvisor Installation Failure
- When DaemonSet deployment fails: Insufficient resources on nodes to schedule cAdvisor Pods. Lower CPU/memory limits in installation options or check node resource availability.
- When port conflict occurs: Default port 8080 is being used by another application. Specify a different port (e.g., 8081) in installation options.
- When image pull fails: Unable to download cAdvisor image. Check cluster node internet connectivity or private registry settings.
Prometheus Installation Failure
- When PVC creation fails: No appropriate StorageClass exists in the cluster. Create a StorageClass first, or change storage option to EmptyDir for testing purposes.
- When OOM (Out of Memory) occurs: Insufficient memory allocated to Prometheus. Increase memory limit in resource settings. Minimum recommended is 1Gi.
- When in CrashLoopBackOff state: Prometheus cannot start due to configuration error. Check logs with
kubectl logscommand, then reinstall after fixing the issue.
Metrics Not Being Collected
- Cause 1: cAdvisor/Prometheus Pod is not in Running state.
- Cause 2: ServiceMonitor configuration error
- Cause 3: Blocked by network policy
Resolution:
- Check Pod status:
kubectl get pods -n monitoring - Check logs:
kubectl logs <pod-name> -n monitoring - Verify network policies.
Delete Monitoring Components
Delete cAdvisor
- Click the Delete button next to cAdvisor status in the Monitoring tab
- Click Delete in the confirmation dialog
- cAdvisor DaemonSet is removed from each node.
Delete Prometheus
- Click the Delete button next to Prometheus status in the Monitoring tab
- Click Delete in the confirmation dialog
- All related resources are removed.
Warning: When deleting Prometheus, stored metric data is also deleted.
Best Practices
Recommendations for a successful monitoring environment.
Resource Planning
Resources to allocate to Prometheus vary by cluster size.
-
Small (1-5 nodes): Allocate 500m CPU and 1Gi memory. Suitable for development and test environments.
-
Medium (5-20 nodes): Allocate 1 core CPU and 2Gi memory. Suitable for staging or small production environments.
-
Large (20+ nodes): Allocate 2 cores CPU and 4Gi or more memory. Suitable for large-scale production environments.
If Prometheus frequently restarts due to OOM or queries become slow, you need to increase resources.
Storage Planning
Use these approximate storage usage figures to plan capacity.
- Per node: About 1-2MB/day
- Per Pod: About 0.5-1MB/day
- Example: 15-day retention, 10 nodes, 100 Pods = About 2-3GB
Performance Optimization
Be careful that your monitoring system doesn't become a burden on the cluster.
- Scrape interval: Default 15 seconds, 30 seconds recommended for large environments.
- Retention period: Set only as long as needed (longer retention requires more storage)
- Label limits: Remove unnecessary labels to manage cardinality.
- Remote storage: For long-term retention, use external storage like Thanos.
Related Guides
- Metrics Server Installation - Basic metrics server installation.
- Runtime Environment Registration - Register K8s cluster.
- Log Monitoring - View container logs.