Dashboard
Path: /dashboard
The Dashboard is the first screen you see when logging into KIWI. It provides a quick overview of all your registered services and their security status, helping you understand the overall state of your systems at a glance.
If you cannot access this page, please request permission from your organization manager.
What You Can Do on the Dashboard
View Service Status at a Glance
See the real-time status of all registered services on a single screen. Each status is color-coded so you can immediately identify services with issues.
- Running (Blue): Service operating normally. No action required.
- Building (Yellow): Container image being created. Wait for completion.
- Deploying (Yellow): Service being deployed to runtime. Wait for completion.
- Restarting (Yellow): Container/Pod restarting. Wait for completion.
- Build Failed (Red): Build error occurred. Check logs and fix.
- Deploy Failed (Red): Deployment error occurred. Check logs and fix.
- Stopped (Gray): Intentionally stopped. Restart if needed.
- Registered (Gray): Registered only, not deployed. Deploy needed.
Monitor Security Risk Levels
Security scan results for each service are summarized as risk levels. This is a comprehensive score combining all security scan results including SAST, SCA, and DAST.
- Critical (Red): Critical vulnerabilities exist. Immediate action required.
- High (Orange): Serious vulnerabilities exist. Urgent action required.
- Medium (Yellow): Security issues exist. Address on schedule.
- Low (Blue): Minor issues exist. Monitoring only needed.
- SAST (Static Application Security Testing): Static analysis that finds security vulnerabilities by analyzing source code.
- SCA (Software Composition Analysis): Checks for known vulnerabilities in open-source libraries you're using.
- DAST (Dynamic Application Security Testing): Dynamic testing performed against a running application.
View Service Details
Click on a service from the dashboard to go to its detail page where you can view pipeline status, runtime state, and connected resources. Add frequently checked services to favorites for easy access.
The Dashboard is a monitoring-only page. To run builds, deployments, and other actions, navigate to [Service Management] from the left menu.
Screen Layout
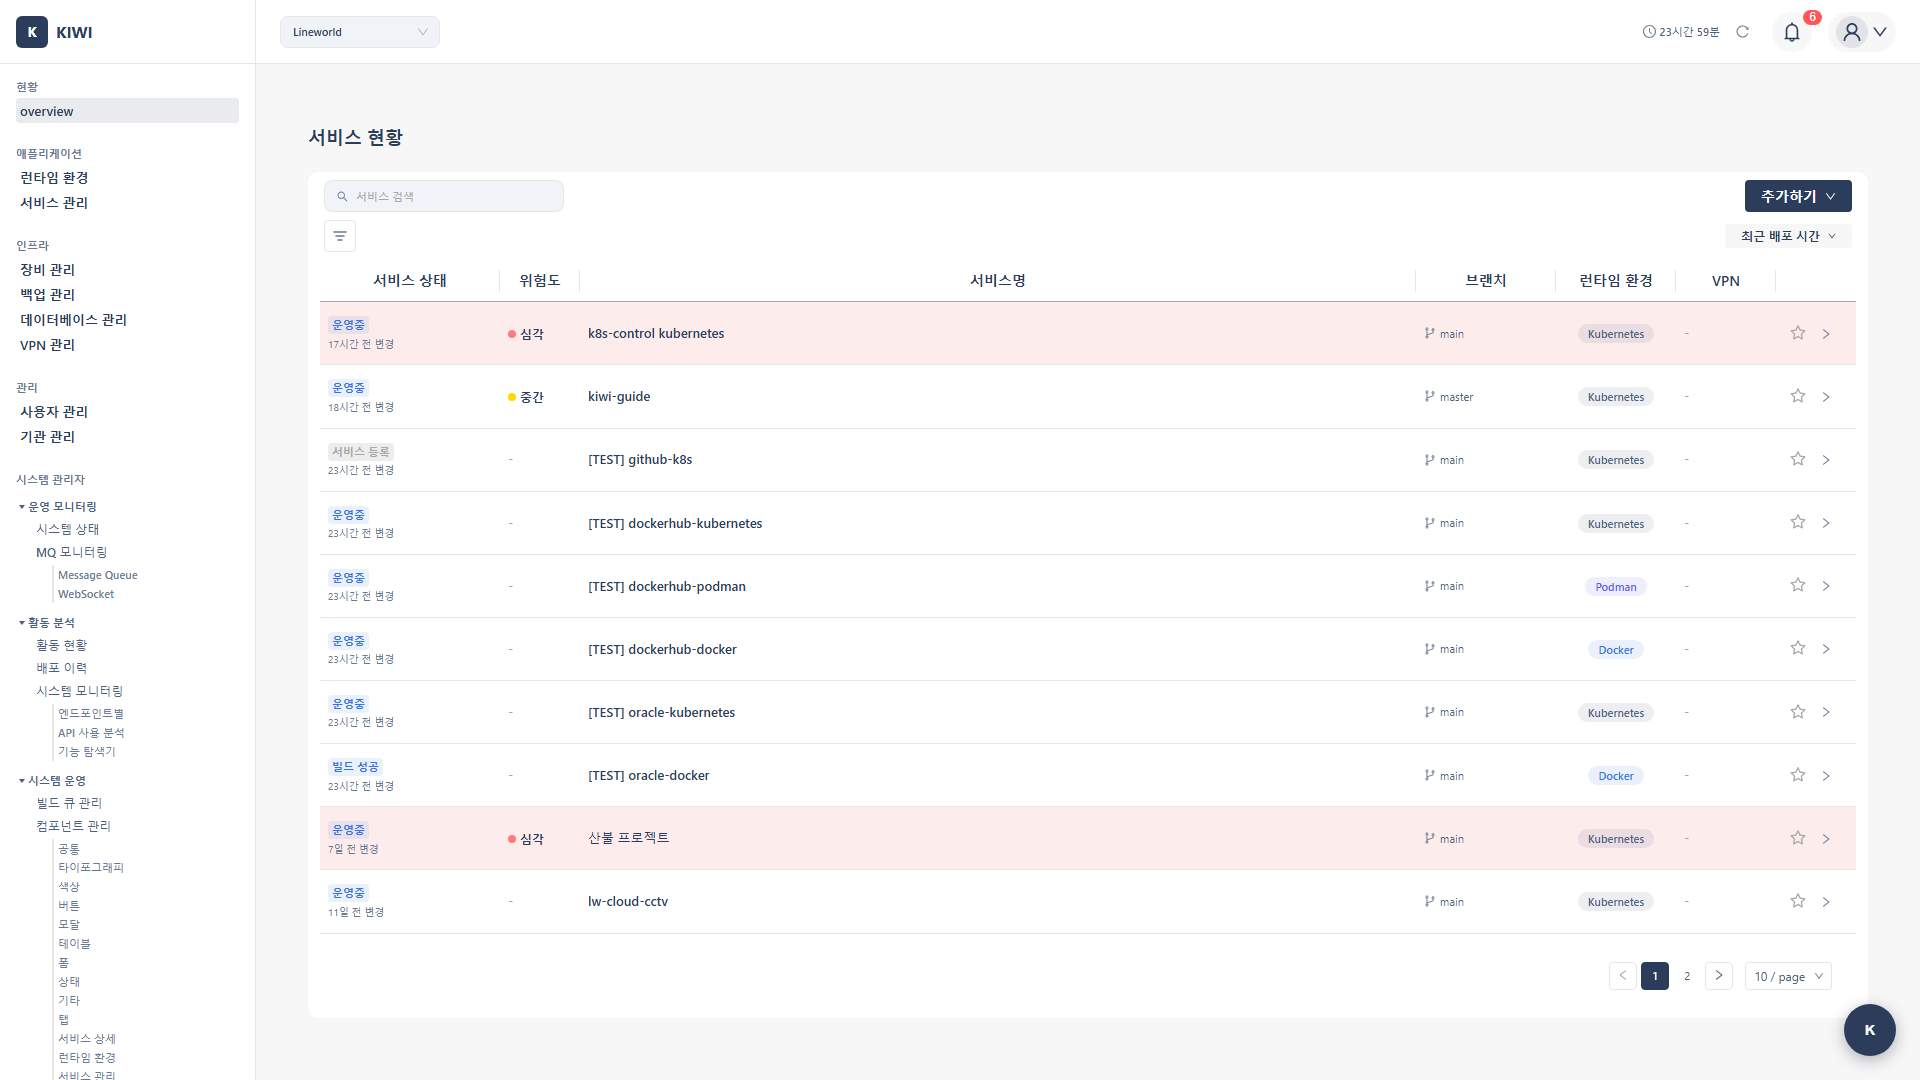
Service List Table
The main area of the dashboard displays a table of services.
- Favorites: Click the star icon to set. Favorited services appear at the top of the list.
- Service Name: Click to navigate to the service detail page.
- Status: Current service status displayed as a badge.
- Risk Level: Security scan results categorized as Critical/High/Medium/Low.
- Branch: Currently connected Git branch. Can be changed via dropdown.
- Runtime: Environment where the service is deployed (K8s, Docker, etc.).
- Last Modified: Time of last change.
Service Detail Screen
Click on a service name to go to its detail page. It consists of two tabs.
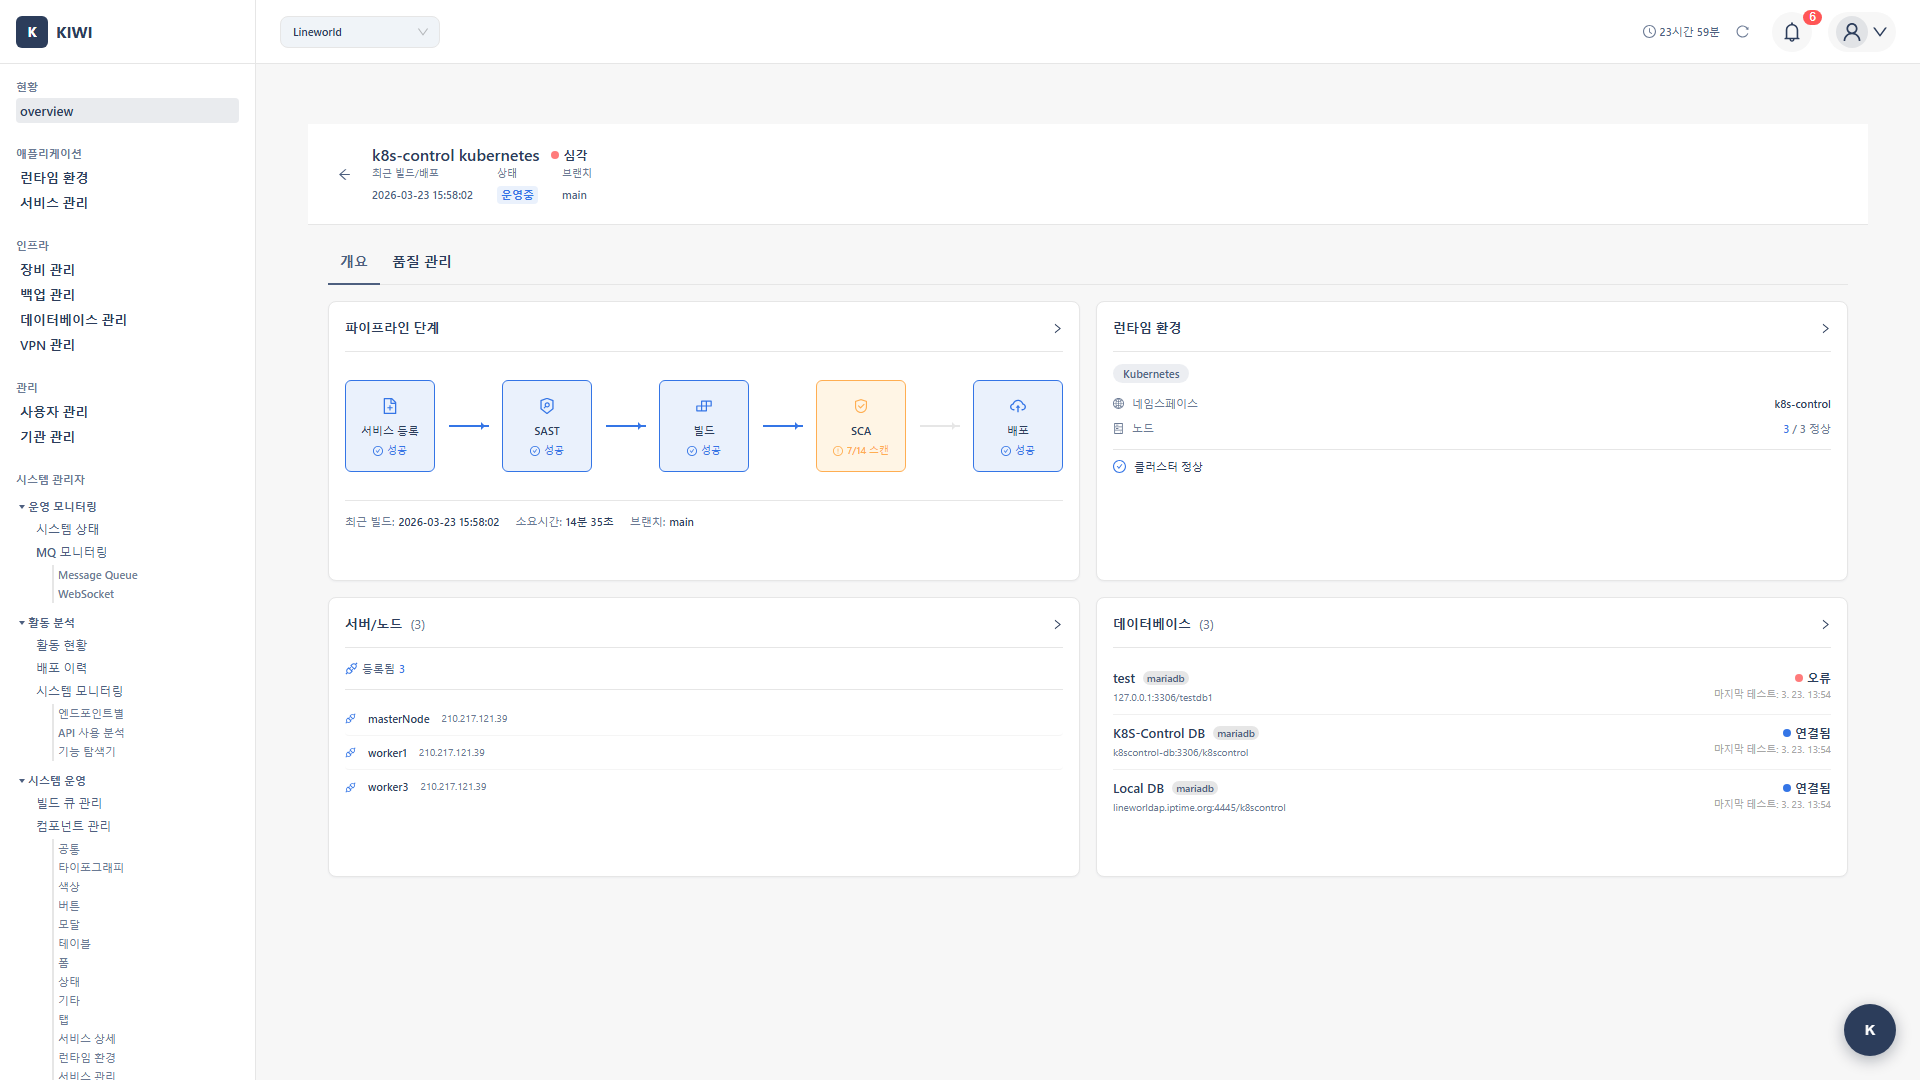
Overview Tab
View the current status and pipeline flow of the service.
- Pipeline Flow Diagram: Visual display of status for Source → Build → Security Scan → Deploy stages.
- Runtime Environment: Deployed infrastructure info, Pod status, resource usage
- Connected Resources: Device and database lists.
Quality Management Tab
View DevOps performance metrics and incident history.
- DORA Metrics: Core DevOps metrics including deployment frequency, lead time, failure rate, MTTR
- Vulnerability Summary: Count of Critical/High/Medium/Low vulnerabilities.
- Incident History: Records of incidents and recovery.
How to Use
Checking Service Status
- Navigate to the Dashboard page
- Check the Status column in the service list
- If there are any red statuses (Build Failed, Deploy Failed), click on that service to investigate.
Use the filter function at the top to view only services with specific statuses or risk levels. This is useful for quickly checking services with issues.
Setting Favorites
Add frequently managed services to favorites so they appear at the top of the list for quick access.
- Click the star icon on the service row
- When the star is filled, favorites are set
- Favorited services are grouped at the top of the list
Favorites are saved only in your current browser. You'll need to set them again on different browsers or devices.
Changing Branches
Change a service's Git branch directly from the dashboard.
- Click the dropdown in the Branch column
- Select the branch to switch to
- The service switches to the selected branch
Understanding DORA Metrics
DORA metrics are DevOps performance measurement indicators defined by DevOps Research and Assessment. Developed by a research program sponsored by Google Cloud, they are recognized as industry standards.
Four Key Metrics
- Deployment Frequency: How often you deploy to production. Good performance target: Daily or more.
- Lead Time: Time from code commit to production deployment. Good performance target: Under 1 hour.
- Change Failure Rate: Rate of deployments resulting in failure or rollback. Good performance target: 15% or less.
- MTTR: Average time to recover service after an incident. Good performance target: Under 1 hour.
Performance Levels
DORA metric performance levels are categorized into four tiers.
- Elite: Deployment Frequency: Daily+, Lead Time: Under 1 hour, Failure Rate: 15% or less, MTTR: Under 1 hour.
- High: Deployment Frequency: Weekly+, Lead Time: Under 1 day, Failure Rate: 30% or less, MTTR: Under 1 day.
- Medium: Deployment Frequency: Monthly+, Lead Time: Under 1 week, Failure Rate: 45% or less, MTTR: Under 1 week.
- Low: Deployment Frequency: Less than monthly, Lead Time: 1 month+, Failure Rate: Over 45%, MTTR: 1 month+.
- Increase Deployment Frequency: Set up Auto CI for automatic build/deploy on push
- Reduce Lead Time: Use build cache, optimize tests.
- Lower Failure Rate: Thoroughly test in staging environment before deploying.
- Shorten MTTR: Automate rollbacks, set up monitoring alerts.
Common Tasks
Running Build/Deploy
Builds and deployments are executed in the [Service Management] page.
- Click [Service Management] from the left menu
- Select the target service.
- Run the action from the Build or Deploy tab
Click on the pipeline flow diagram in the dashboard detail page to navigate directly to the [Service Management] page for that service.
Registering an Incident
Recording incidents is reflected in DORA metrics MTTR calculations.
- Go to the service detail page → Quality Management tab
- Click the Register Incident button in the Incident History section.
- Enter incident information and save.
Viewing Runtime Details
- Go to the service detail page → Overview tab
- Click on the runtime environment card
- View detailed information like Pod status and resource usage
Glossary
- Pod: The smallest deployable unit in Kubernetes that runs containers.
- Runtime Environment: Infrastructure environment where services run (Kubernetes, Docker, etc.).
- Pipeline: Automated software delivery process consisting of build, test, and deploy stages.
- Branch: A pointer representing an independent development line in a Git repository.
- Badge: A UI element that visually displays status or labels.
- MTTR: Mean Time to Recovery, average time to recover service after an incident.
Good to Know
- Real-time Updates: Dashboard data is automatically updated in real-time. You can see the latest status without refreshing.
- DORA Metrics Period: DORA metrics are calculated based on the last 30 days of data.
- Favorites Storage: Favorites are saved only in your current browser, so you'll need to set them again on different devices.