Metrics Server Installation
Want to use HPA (auto-scaling) or monitor Pod resource usage? Then you need to install the Metrics Server first.
Kubernetes doesn't track Pod CPU/memory usage by default. Installing Metrics Server collects this information and makes it available for HPA, dashboards, kubectl top commands, and more.
What is Metrics Server?
Metrics Server is an official Kubernetes component that collects and provides resource usage data for the cluster. Think of it as the "health checkup tool" for your cluster.
Key Features
Here are the core capabilities that Metrics Server provides.
-
Node Resource Monitoring: Collects CPU and memory usage of each node in the cluster in real-time. Use this to understand resource status per node for capacity planning.
-
Pod Resource Monitoring: Collects CPU and memory usage of each Pod. Analyze which applications are using the most resources.
-
HPA (Horizontal Pod Autoscaler) Support: HPA automatically adjusts the number of Pods based on data provided by Metrics Server. HPA does not work without Metrics Server.
-
kubectl top Command Support: Check resource usage directly from the terminal using
kubectl top nodesandkubectl top podscommands.
- When you want to view resource usage in the KIWI dashboard
- When you want to use HPA (auto-scaling)
- When you need resource-based scheduling.
- When you want to set up operational monitoring.
Prerequisites
Check the following before starting installation.
- A Kubernetes cluster must be registered in KIWI
- Cluster administrator permissions are required.
If you cannot access this feature, please request permission from your organization manager.
Step 1: Navigate to Runtime Environment Page
First, select the cluster where you want to install Metrics Server.
- Click [Runtime Environments] in the left menu
- Find the Kubernetes cluster where you want to install Metrics Server.
- Click the cluster name to go to the detail page
You need to install Metrics Server separately on each cluster.
Step 2: Check Monitoring Tab
- Click the Monitoring tab on the cluster detail page
- Check the metrics server status:
- Installed: Metrics server is already installed.
- Not Installed: Metrics server installation needed.
Information Displayed When Not Installed
When the metrics server is not installed:
- Node/Pod resource usage displays as "N/A"
- Install Metrics Server button is enabled.
kubectl topcommand execution results in an error
Step 3: Install Metrics Server
3.1 Click Install Button
- Click the Install Metrics Server button.
- An installation confirmation dialog appears.
3.2 Review Installation Options
Review the following options before installation:
- Version: Select the metrics-server version to install. By default, the latest stable version is selected, and it's recommended to use the default unless you have a specific reason.
- TLS Certificate Verification: Must be disabled in environments using self-signed certificates. The default is disabled, and you can enable it in environments using public certificates.
- Resource Requests: Resources to allocate to the metrics-server Pod. Default is CPU 100m, Memory 200Mi, and may need to be increased for large clusters.
3.3 Execute Installation
- Click the Install button.
- Installation progress is displayed:
- Deploy to
kube-systemnamespace. - Create ServiceAccount and RBAC
- Create Deployment
- Create Service
- Deploy to
3.4 Verify Installation Completion
When installation is complete:
- "Metrics server has been installed" message appears.
- Status changes to Installed
- Resource usage data is collected after 1-2 minutes.
Step 4: Verify Installation
4.1 Verify in KIWI
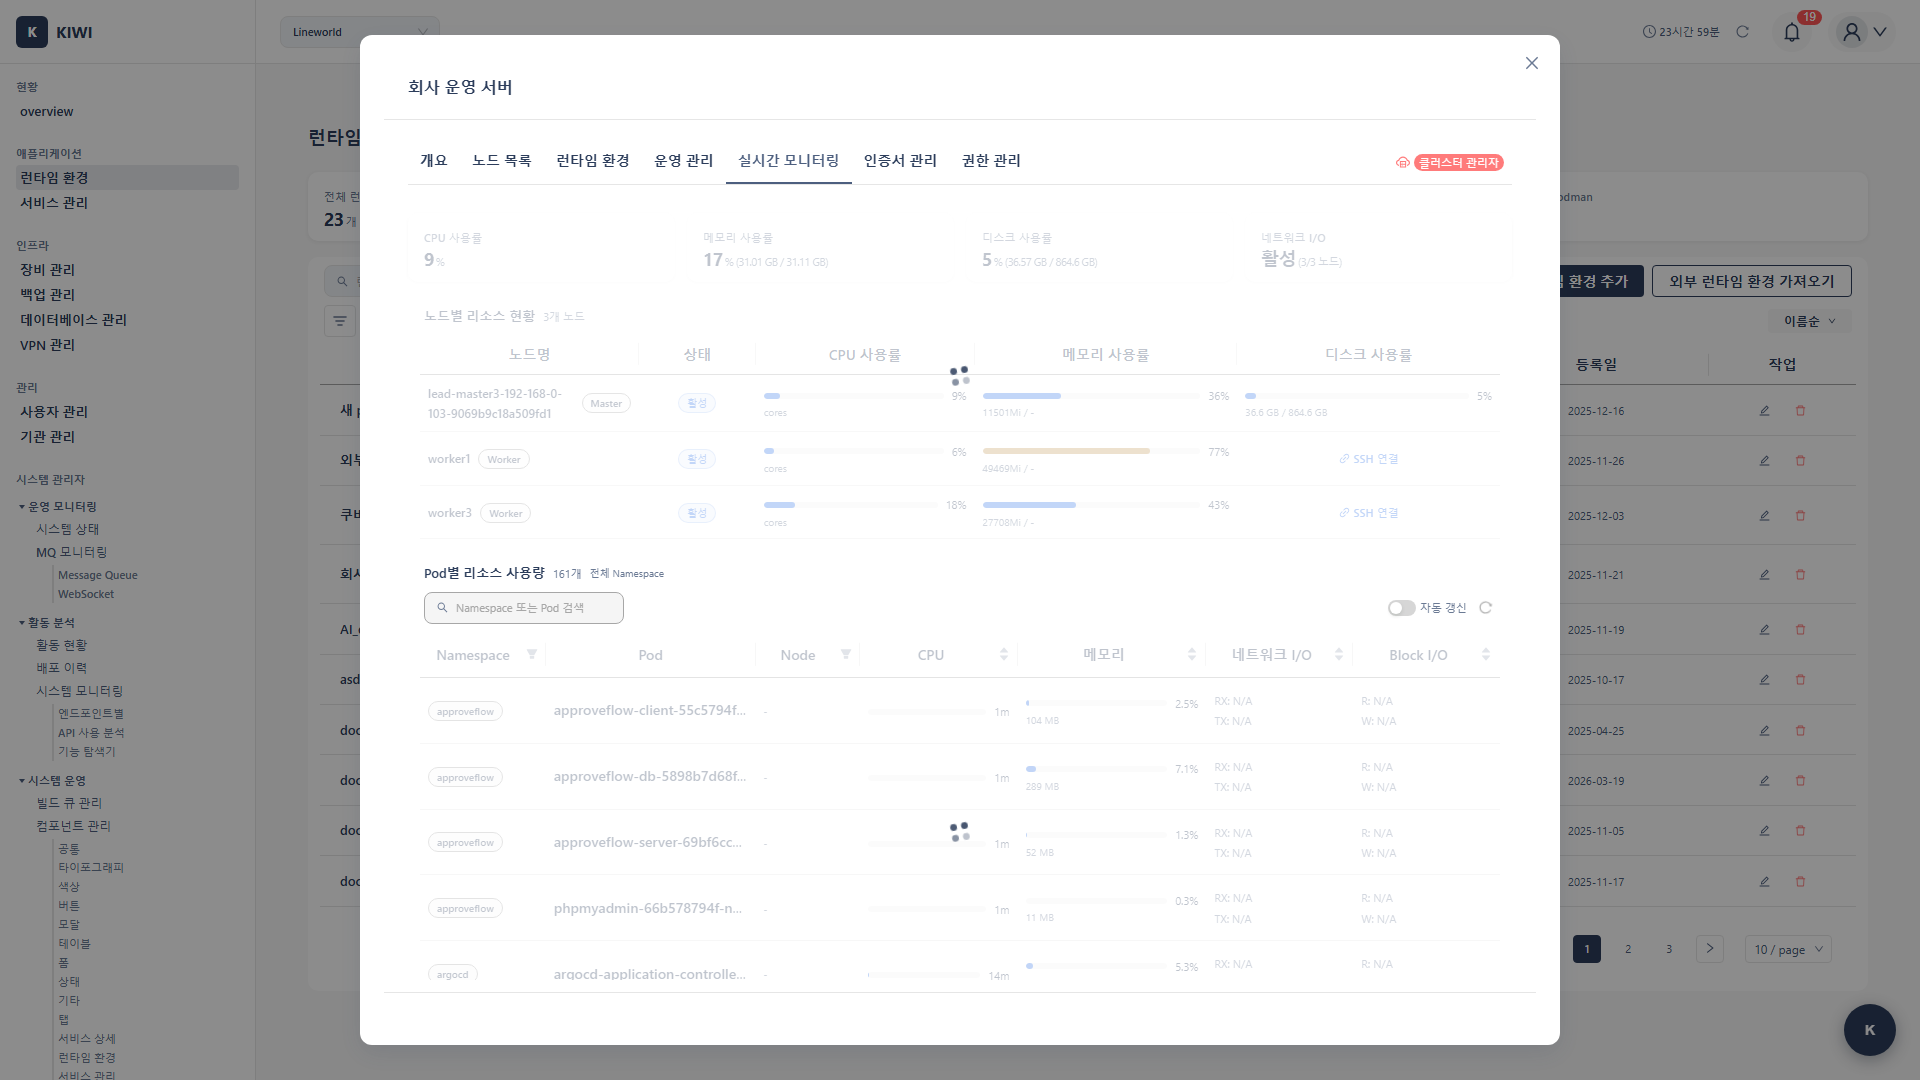
- Check node resource usage in the Monitoring tab
- Verify that CPU, memory usage is displayed for each node.
- Check Pod resources in the service operations screen
4.2 Verify with kubectl (Optional)
If you have direct access to the cluster:
# Check metrics server Pod status
kubectl get pods -n kube-system | grep metrics-server

# Check node resources
kubectl top nodes

# Check Pod resources
kubectl top pods --all-namespaces
Example of normal output:
NAME           CPU(cores)   CPU%   MEMORY(bytes)   MEMORY%
node-1         250m         12%    1024Mi          25%
node-2         180m         9%     768Mi           19%
Post-Installation Usage
View in KIWI Dashboard
Information available in KIWI after metrics server installation:
- Nodes Tab: CPU/memory usage for each node.
- Service Operations: Resource usage for each Pod
- Dashboard: Cluster-wide resource status.
HPA Configuration (Auto Scaling)
Once metrics server is installed, you can use HPA:
- Select Enable HPA option in service deployment settings.
- Configure scaling conditions:
- Minimum/maximum replica count
- CPU usage threshold
- Memory usage threshold
Troubleshooting
Installation Failure
- When permission error occurs: Insufficient RBAC permissions to create metrics-server resources. Verify that the ServiceAccount used by KIWI has cluster administrator permissions.
- When network error occurs: Unable to download the metrics-server image. Check if cluster nodes are connected to the internet, or verify private registry settings.
- When timeout occurs: The cluster is not responding. Check the cluster connection status on the Runtime Environment page and verify the API server is functioning properly.
No Data After Installation
- Cause: Time is needed to collect metrics (1-2 minutes)
- Check: Verify metrics-server Pod is in Running state.
- Action: Refresh after a short wait.
metrics-server Pod in CrashLoopBackOff State
This can occur in environments using self-signed certificates:
- Click Reinstall button in KIWI
- Select Disable TLS Certificate Verification option.
- Execute reinstallation
Only Specific Node Has No Data
- Cause: kubelet communication issue
- Check: Check network status of that node.
- Action: Allow port 10250 in node firewall
Delete Metrics Server
If the metrics server is no longer needed:
- Click Delete Metrics Server button in the Monitoring tab
- Click Delete in the confirmation dialog
- All related resources are deleted.
Effects after deletion:
- Resource usage data displays as "N/A"
- HPA stops working
kubectl topcommand fails.
Related Guides
- Runtime Environment Registration - Register Kubernetes cluster.
- Log Monitoring - View container logs.
- Container Management - Pod restart and scaling.