Operations Management
Once you have deployed your service, the real work begins. KIWI's Operations Modal (Operate Modal) lets you manage and monitor your deployed service's Pods and Containers in real time.
Deployment is just the beginning. Real-world service operations require log monitoring, resource tracking, troubleshooting, scaling, and more. KIWI's Operations Modal brings all these tasks together in one convenient place.
Operations Feature Overview
flowchart TB
    A[Operations Modal] --> B[Overview]
    A --> C[Pod/Container]
    A --> D[Deployment]
    A --> E[Logs]
    A --> F[Execute]
    A --> G[DAST]

    C --> C1[List]
    C --> C2[Status]
    C --> C3[Delete/Restart]

    D --> D1[Scaling]
    D --> D2[HPA Management]
    D --> D3[Rollback]

    E --> E1[Real-time Logs]
    E --> E2[Log Filtering]

    F --> F1[Command Execution]
    F --> F2[Shell Access]
Supported Features by Runtime
Different features are available depending on whether you are using Kubernetes or Docker/Podman. Check the table below for details.
Kubernetes features:
- Pod/Container Management: Pod list, status, deletion .
- Scaling: Deployment scale, HPA
- Log Viewing: Pod logs .
- Command Execution: kubectl exec
- Resource Monitoring: Metrics Server integration .
- Domain Management: Ingress
- DAST Scan: Supported
Docker/Podman features:
- Pod/Container Management: Container start/stop/restart/delete .
- Scaling: N/A
- Log Viewing: Container logs .
- Command Execution: docker exec
- Resource Monitoring: docker stats .
- Domain Management: Service domain
- DAST Scan: Supported
Kubernetes provides advanced features like auto-scaling (HPA), while Docker/Podman is ideal for simple Container management on a single host. Choose the runtime that best fits your project requirements.
Accessing the Operations Modal
The Operations Modal is your central hub for service management. Follow these simple steps to access it.
How to Open
- Navigate to the [Service Management] page
- Click the Operate stage in the row of the service you want to manage
- The Operations Modal opens .
Add frequently used services to your favorites for faster access.
Modal Tab Layout
Kubernetes Service
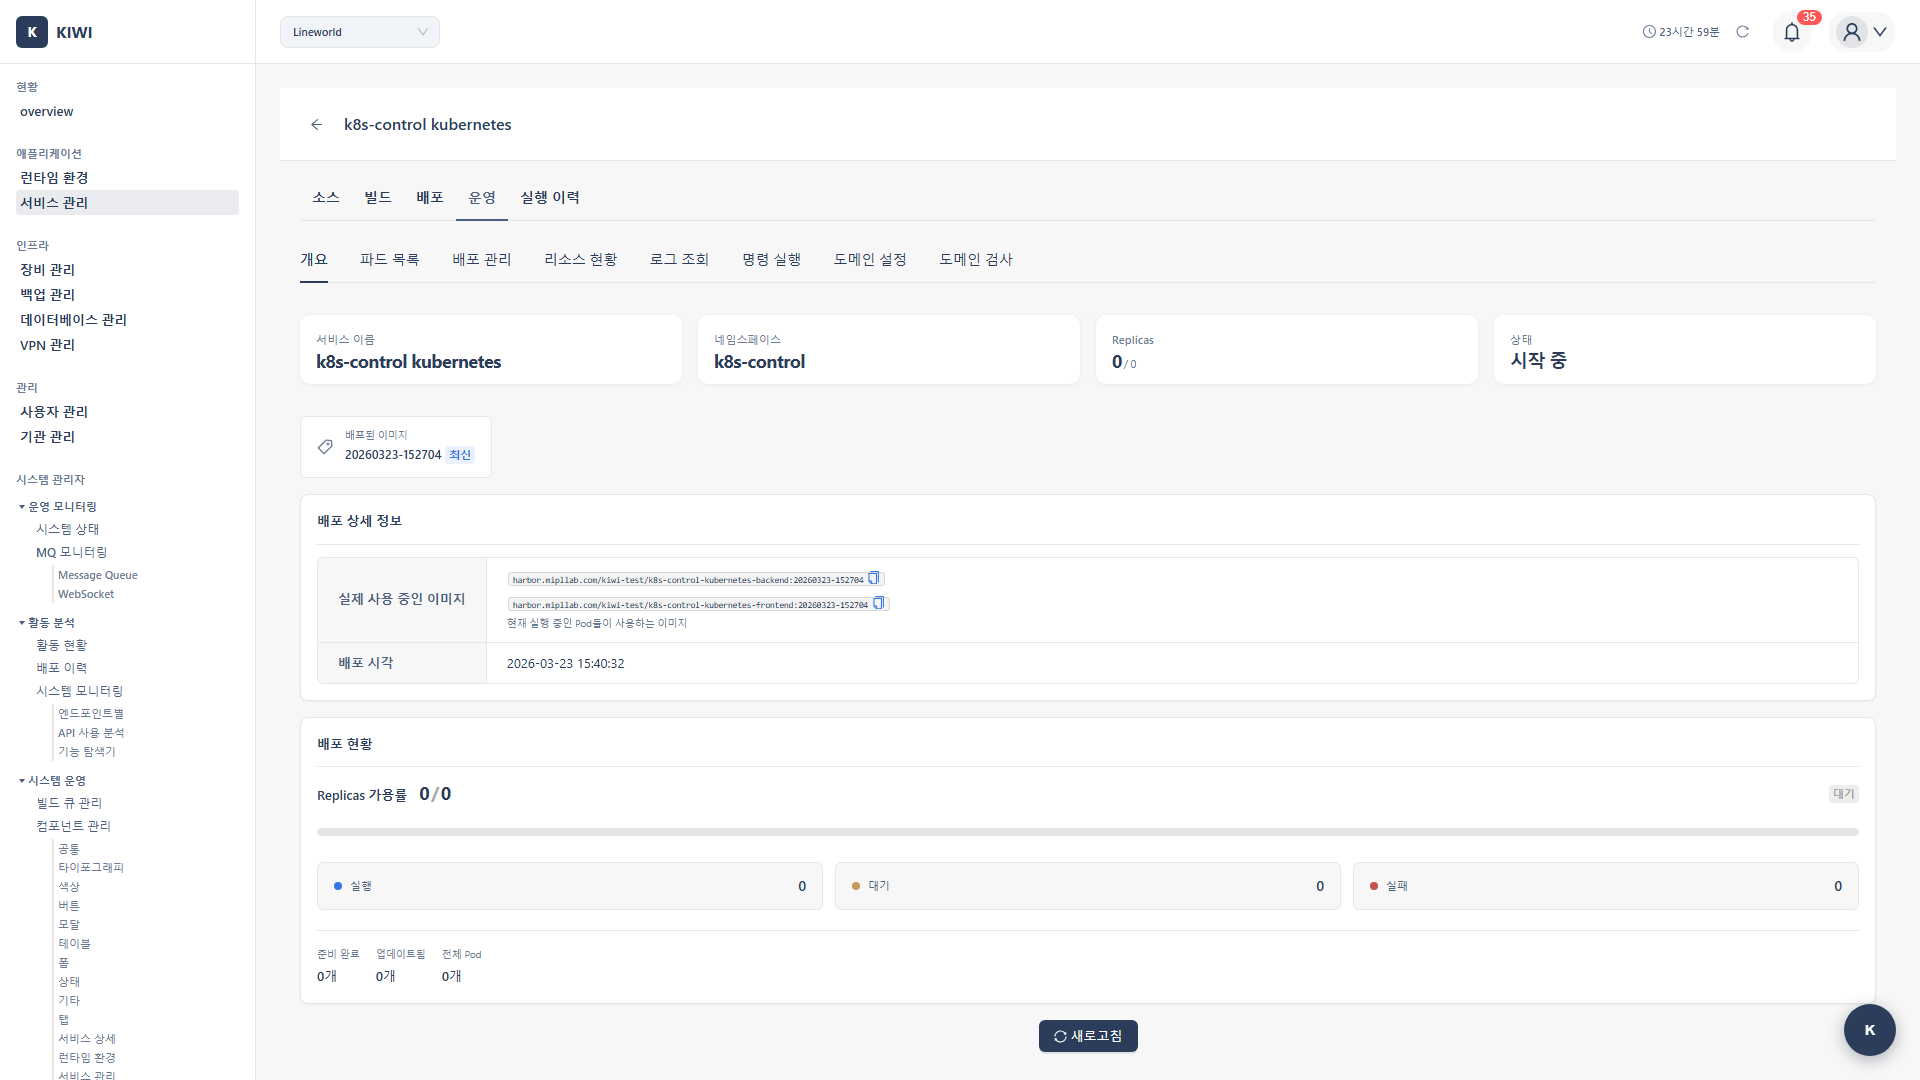
- Overview: Basic service information, deployment status summary .
- Pod List: Pod list, status, scaling, HPA management .
- K8s Deployment: Deployment settings, rollback, image change
- K8s Resources: ConfigMap, Secret, PV/PVC view
- K8s Certificates: TLS certificate management .
- Logs: Real-time Pod log viewing .
- Execute: Execute commands within a Pod
- Domain: Ingress domain settings .
- DAST: Dynamic security testing .
Docker/Podman Service
- Overview: Basic service information .
- Container List: Container list, control (start/stop/restart)
- Docker Deployment: Container redeployment, image update .
- Docker Ops: System information, resource usage
- Docker Resources: Volume and network information .
- Logs: Container log viewing .
- Execute: Execute commands within a container .
- Domain: Domain settings
- DAST: Dynamic security testing .
Operations Scenario Guides
Choose the guide that fits your situation and follow along.
Basic Operations
Essential features for day-to-day service operations.
- Log Monitoring: View and filter logs in real time to quickly identify issues .
- Container Management: Control and scale Pods/Containers to keep your service running smoothly .
- Shell Access: Execute remote commands for in-depth debugging .
Cluster Management
Advanced management features for Kubernetes clusters. These features are accessed from the [Runtime Environment] page by selecting a K8s cluster.
- Metrics Server Installation: Install the Metrics Server, the foundation for HPA and resource monitoring .
- Monitoring Extension: Set up detailed real-time monitoring with Prometheus and cAdvisor
- K8s RBAC Management: Manage team permissions using ServiceAccounts and namespaces .
- K8s Certificate Renewal: Check and renew cluster certificates before they expire
- HPA Auto Scaling: Automatically scale Pods up or down based on traffic
Key Feature Details
Pod/Container Status Management
Pod Status Types (Kubernetes)
- Running (Green check): Running normally. No action needed.
- Pending (Yellow spinner): Scheduling or image pulling in progress. Check events for details.
- Succeeded (Green check): Completed (Job). No action needed.
- Failed (Red X): Execution failed. Check logs and consider restarting.
- Unknown (Gray): Unknown state. Check node status.
Container Status (Docker)
- running: The container is running. Available actions: Stop, Restart.
- paused: The container is paused. Available actions: Unpause, Stop.
- exited: The container is stopped. Available actions: Start, Remove.
- created: The container is created but not started. Available actions: Start, Remove.
Scaling (Kubernetes)
Manual Scaling
- Navigate to the Pod List tab
- Select a Deployment .
- Enter the desired replica count
- Click the Scale button .
Scale options:
- Scale Up: Increase replica count .
- Scale Down: Decrease replica count .
- Scale to Zero: Set to 0 (temporary suspension)
HPA (Horizontal Pod Autoscaler)
Configure HPA for automatic scaling.
- Min Replicas: Minimum Pod count. Recommended value is 2 for high availability.
- Max Replicas: Maximum Pod count. Recommended value is 10.
- CPU Target: Target CPU utilization percentage. Recommended range is 70-80%.
- Memory Target: Target memory utilization percentage. Recommended range is 70-80%.
A Metrics Server must be installed in the cluster to use HPA. KIWI allows you to check and install the Metrics Server status.
Log Monitoring
Log Viewing Options
- Pod/Container selection: Select the target to view logs for
- Lines: Number of log lines to display (100, 500, 1000)
- Follow: Real-time log streaming (tail -f)
- Timestamps: Whether to display timestamps .
- Previous: Logs from the previous container (if restarted)
Log Search
- Filter for specific keywords using the search functionality within the log viewer .
- Search by log level:
ERROR,WARNING,INFO, etc. - Supports regular expressions
Command Execution (Execute)
Single Command Execution
- Navigate to the Execute tab
- Select the target Pod/container .
- Enter the command
- Click the Execute button .
Commonly Used Commands
# Check processes
ps aux

# Check memory
free -m

# Disk usage
df -h

# Check network connections
netstat -tlnp

# Check environment variables
env | grep -i <keyword>

# View file contents
cat /app/config/application.yml

# View log file
tail -f /var/log/app.log
Permissions and Security
Operations features include sensitive tasks, so proper permission management is essential.
If you cannot access operational features, please request permission from your organization manager.
Audit Log
For security and traceability, all operational tasks are automatically recorded in the audit log.
- Command execution history: Track who ran what command and when
- Scale change history: Record of Pod count changes .
- Pod/Container deletion history: Track deleted resources .
- Deployment change history: Record of image and configuration changes .
When issues occur, you can trace who performed what actions, helping with root cause analysis and accountability.
Troubleshooting
Common Issues
- Pod list not displayed: Caused by insufficient permissions or inaccessible namespace. Resolution: Check kubeconfig permissions.
- Log retrieval failure: Caused by terminated Pod or network issue. Resolution: Check Pod status and use the Previous option.
- Command execution failure: Caused by no shell in the container. Resolution: Check if the image includes /bin/sh.
- HPA creation failure: Caused by Metrics Server not being installed. Resolution: Install Metrics Server.
Kubernetes Issues
- Persistent Pending status: Insufficient resources or node issue. Check events with
kubectl describe pod. - CrashLoopBackOff: Application error. Check logs and review settings.
- ImagePullBackOff: Image pull failed. Check image path and registry authentication.
Docker Issues
- Container not starting: Port conflict or volume issue. Check error with docker logs.
- No logs: Container is not outputting to stdout. Check application log settings.
Best Practices
Follow these recommendations for safe and efficient operations.
Operational Safety
Always act carefully when working in production environments.
- Use Execute with caution: Always double-check before running data-modifying commands (rm, mv, etc.) in production .
- Announce Scale to Zero in advance: Notify relevant teams before stopping a service, as it will cause downtime
- Check logs regularly: Early detection of error patterns can prevent major issues .
- Review HPA settings: Set appropriate min/max values to prevent sudden scaling changes .
Incident Response Order
A systematic approach to troubleshooting helps you resolve issues faster.
- Check Overview: First, understand the overall status .
- Check Pod status: Look at Running/Pending/Failed states .
- Check logs: Analyze error messages to identify the root cause .
- Run commands: If needed, check env, processes, etc. for additional debugging .
- Restart if needed: Delete the Pod and Deployment will automatically create a new one
Having this order as a checklist helps you stay calm and methodical during emergencies.
Related Guides
- Service Build/Deploy - Pipeline overview
- DAST Scan - Dynamic security testing .
- Rollback - Restore previous version .