Log Monitoring
When something goes wrong with your service, the first thing to check is the logs. KIWI's log monitoring feature makes it easy to view and analyze real-time logs from your Pods and Containers.
Logs are like a "diary" that tells you what your application is doing. Through error messages, warnings, and debug information, you can quickly identify the root cause of problems.
Log Viewing Overview
KIWI supports log viewing in both Kubernetes and Docker/Podman environments.
- Kubernetes: Uses Pod stdout/stderr as the source. Supports real-time log viewing.
- Docker/Podman: Uses Container stdout/stderr as the source. Provides log viewing and line count limit features.
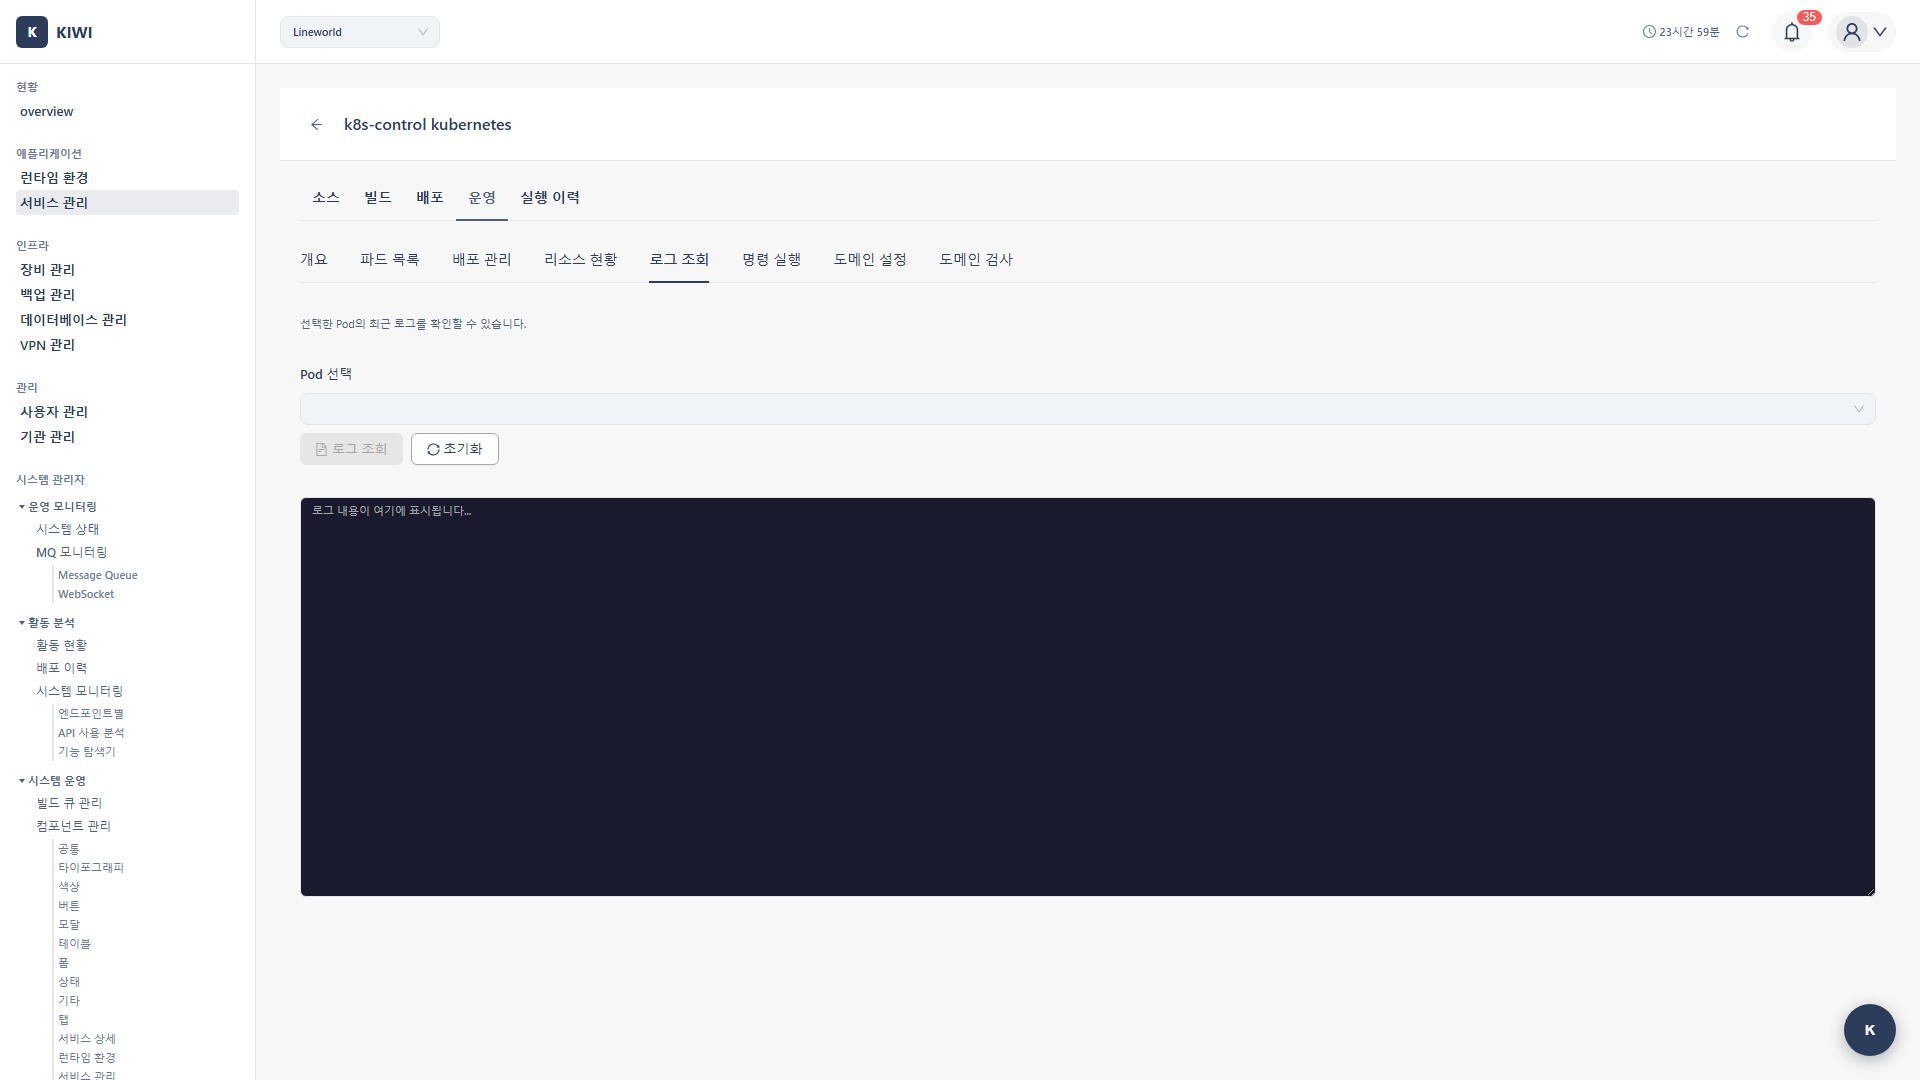
Step 1: Open the Logs Tab
First, select the service whose logs you want to view.
- Go to the [Service Management] page and select the desired service .
- Click the Operate stage
- Select the Logs tab in the Operations Modal .
You need operational permissions for the service to access the Logs tab.
Step 2: Select the Target
Kubernetes
- Select the target Pod from the Select Pod dropdown
- Verify the current status using the Pod status icon
.
- Green check: Running
- Yellow spinner: Pending
- Red X: Failed
Docker/Podman
- Select the target container from the Select Container dropdown
- Confirm the container name and image
Step 3: View Logs
Basic Viewing
- After selecting the target, click the View Logs button .
- Recent logs are displayed in the log viewer .
Log Viewer UI
- Target selection: Pod/container dropdown
- View button: View/refresh logs .
- Clear button: Clear the log screen
- Log area: Monospace font, dark theme
Log Viewer Features
- Dark theme: Dark background for improved readability .
- Monospace font: Optimized for code/log readability .
- Scrolling: Supports scrolling through large volumes of logs .
- Select and copy: Text can be selected and copied .
Log Analysis Techniques
Effective log analysis helps you resolve issues quickly.
Finding Error Logs
Look for these patterns in your logs. Most problems start with keywords like these.
ERROR: Connection refused to database
[ERROR] Failed to bind to port 8080
Exception in thread "main"
panic: runtime error
Press Ctrl+F in the log viewer to search for keywords like ERROR, Exception, or panic to quickly find issues.
Understanding Log Levels
Log levels indicate the importance of the message.
- ERROR (Red): Serious errors that require immediate attention .
- WARN (Yellow): Warnings that don't cause immediate problems but need attention .
- INFO (Blue): Normal operational information .
- DEBUG (Gray): Detailed debug information for developers .
Key Checkpoints
What to look for depends on the type of problem.
- Application startup failure: Initialization errors, port binding failures, dependency connection issues .
- Request processing errors: HTTP 5xx errors, stack traces .
- Performance issues: Response time delays, timeouts, connection pool exhaustion .
- Memory issues: OOM (Out of Memory), GC-related logs .
Real-World Usage Scenarios
Scenario 1: Verifying Service Startup After Deployment
Purpose: Confirm normal startup after deploying a new version .
- Open Operate → Logs tab
- Select the newly created Pod
- Click View Logs
- Messages to look for:
Starting application...
Server started on port 8080
Database connection established
Application ready
Scenario 2: Analyzing Request Failure Causes
Purpose: Identify the cause of API call failures .
- Select the Pod where failures occurred .
- View logs
- Search for error patterns:
Exception,Error,Failed- HTTP status codes (500, 502, 503)
- Analyze stack traces .
Scenario 3: Debugging Restarted Pods
Purpose: Identify the cause of Pod restarts .
When a Pod has been restarted in Kubernetes:
- Select the Pod and view logs .
- Check startup logs for initialization failures .
- If in
CrashLoopBackOffstate, search recent logs for panic, exception . - Check the Events tab for Pod restart reasons (OOMKilled, Liveness Probe failure, etc.)
Log-Based Troubleshooting
Common Error Patterns
-
Connection refused: Usually indicates DB or service connection failure. Check dependent service status and verify network connectivity. -
Port already in use: Indicates a port conflict. Check port settings and ensure no other process is using the same port. -
OutOfMemoryError: Indicates insufficient memory. Increase resource limits in your deployment configuration. -
Permission denied: Indicates insufficient permissions. Check file and directory permissions for the running user. -
No such file or directory: Indicates a missing file. Check ConfigMap and Volume mounts are correctly configured.
Java Applications
// Check stack trace
java.lang.NullPointerException
    at com.example.MyClass.method(MyClass.java:42)

// Resolution: Add null check at the affected line
Node.js Applications
// Unhandled exception
UnhandledPromiseRejectionWarning
Error: connect ECONNREFUSED 127.0.0.1:5432

// Resolution: Check DB connection settings
Python Applications
// Import error
ModuleNotFoundError: No module named 'requests'

// Resolution: Add dependency to requirements.txt
Downloading Logs
Saving Logs
- Select all text in the log area (Ctrl+A)
- Copy (Ctrl+C)
- Paste into a text editor
- Save as a
.logor.txtfile .
Sharing Logs
- When sharing a problem with team members, extract only the relevant logs .
- Remove sensitive information (passwords, tokens) before sharing .
Troubleshooting
Logs not displayed
- Pod in Pending state: Wait until the Pod is in Running state.
- Container not outputting to stdout: Check application log settings.
- Insufficient permissions: Check service operations permissions.
Connection dropped
- Unstable network: Try refreshing or reopening the modal.
- Session timeout: Log in again and retry.
Too many log entries
- Limit line count: Set the Lines option to 100.
- Keyword search: Filter by error keywords.
- Narrow time range: Focus on the time the issue occurred.
Best Practices
Here are some log analysis tips learned from experience.
Efficient Log Analysis
Follow these steps in order to quickly identify most problems.
- Check the most recent logs first: The most recent error is most likely the root cause .
- Trace error chains: Start from the first error and follow the chain of cascading errors .
- Use timestamps: Cross-reference issue timing with log timestamps to narrow down the scope
- Understand the context: Read surrounding logs to understand the full situation .
Improving Log Quality (For Developers)
Good logs significantly reduce debugging time.
- Use appropriate log levels: Use ERROR, WARN, INFO, DEBUG appropriately for each situation .
- Structured logs: Output in JSON format for easier parsing and searching .
- Include context: Include tracking information like request ID and user ID
- Exclude sensitive information: Mask passwords and tokens to maintain security .
Make sure logs don't contain passwords, API keys, or personal information. Logs can be viewed by many people.
Related Guides
- Container Management - Pod/Container control
- Shell Access - Command execution .
- Operations Management Overview - Full operations feature set