Service Management
Path: /services, /services/edit/:id
Service Management is the core page of KIWI. From here, you can build your Git repository source code into container images, deploy to Kubernetes or Docker environments, and manage security vulnerabilities—all in one place.
If you cannot access some features, please request permission from your organization administrator. Permission settings can be checked on the [Permissions] page.
Why Do You Need Service Management?
In modern software development, build, deploy, and security are as important as writing code. The Service Management page helps you handle all these processes from a single screen.
- Git Integration: Solves the problem of managing code across multiple repositories being cumbersome. Key benefit: Connect and manage all repositories in one place.
- Automatic Build: Solves the problem of manual build errors and time waste. Key benefit: Automatic image creation on code push.
- One-Click Deploy: Solves the problem of complex deployment commands and configurations. Key benefit: Deploy to multiple environments with a single button.
- Security Scanning: Solves the problem of discovering vulnerabilities too late. Key benefit: Detect security issues early in development.
Key Features
Git Repository Integration
Connect GitLab repositories using tokens, select branches or tags to work with, and configure automatic build triggers to start builds when code changes.
A Git token (Personal Access Token) is an authentication credential for accessing the GitLab API. It is used instead of a password and allows you to grant only the necessary permissions, making it more secure. At minimum, read_repository permission is required.
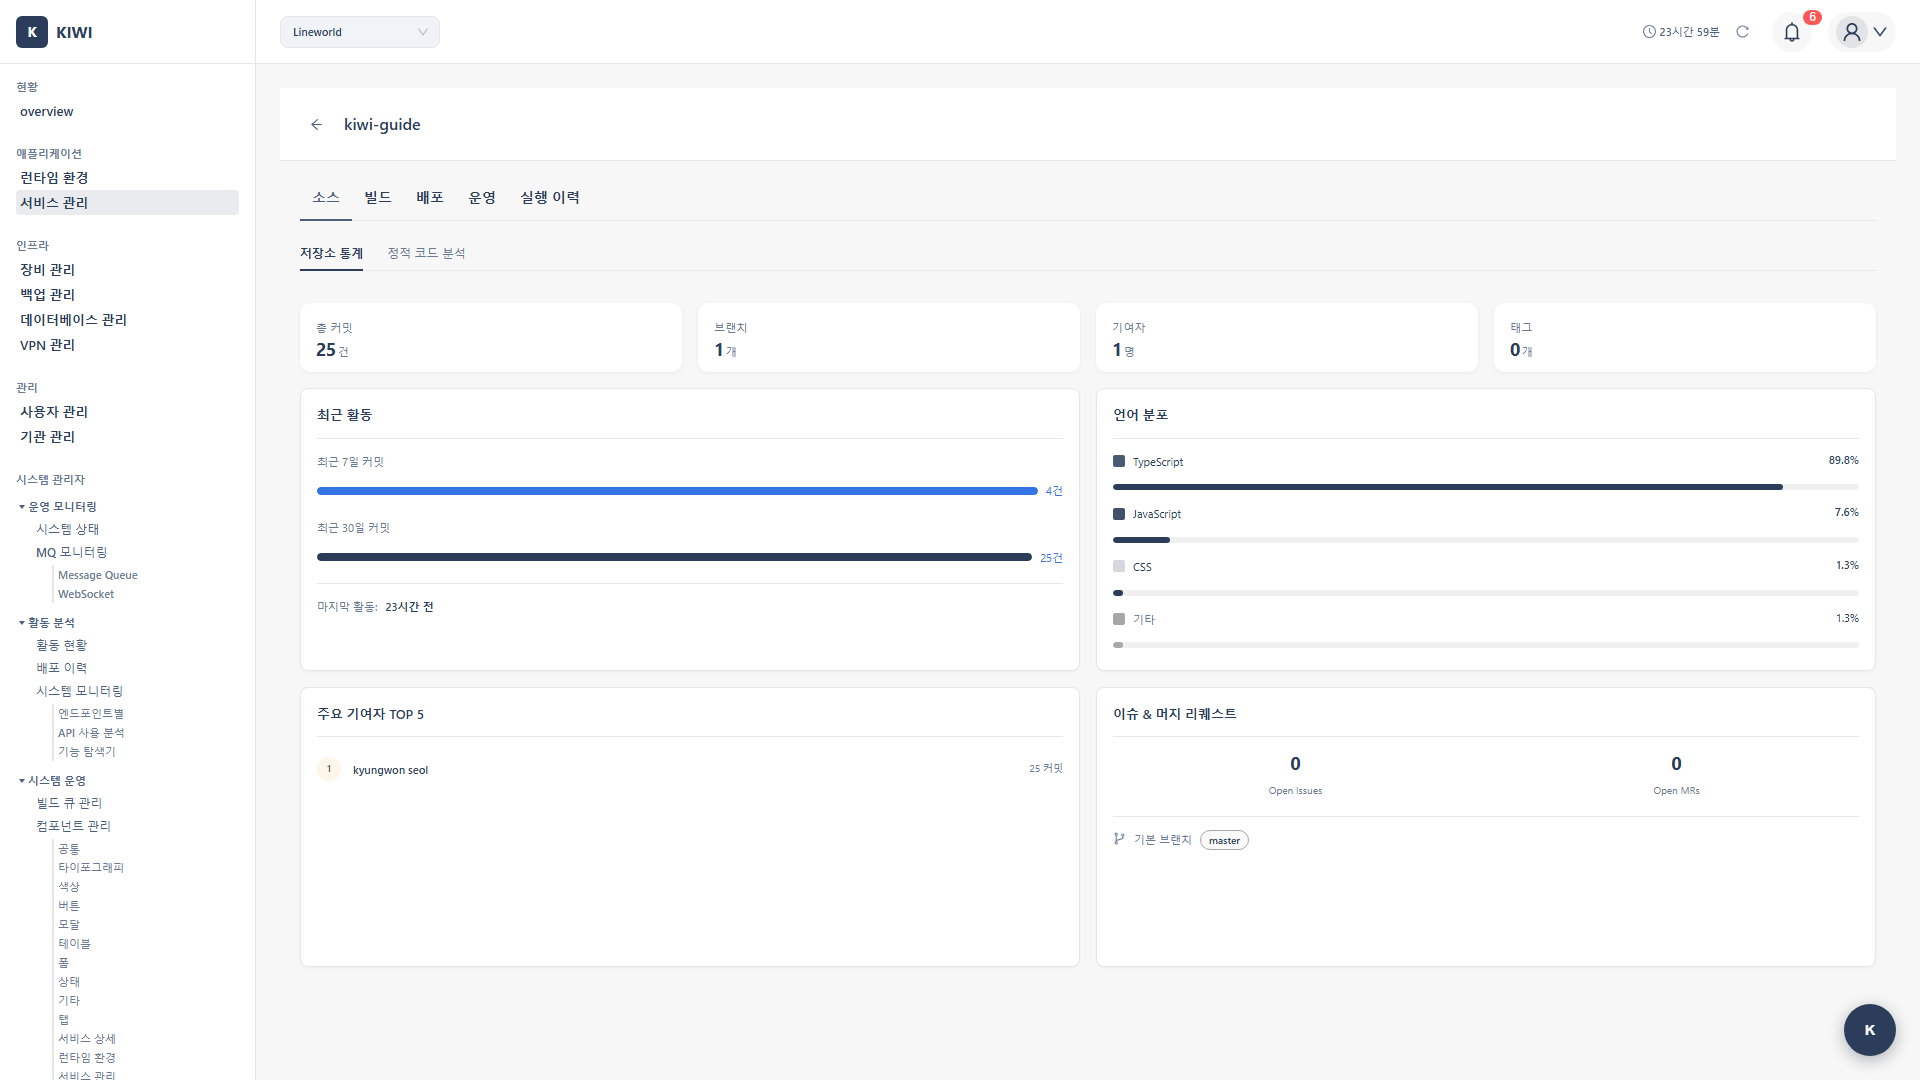
Information Available in the Source Tab
You can view Git repository information in the Source tab of the service detail page:
- Repository Connection Status: GitLab token validity and connection status.
- Branch List: All branches in the repository and the currently selected branch
- Recent Commits: Recent commit history, commit messages, and authors.
- Contributors: List of developers who contributed to the repository.
- Language Breakdown: Programming language usage percentages in the repository.
- Tag List: Created Git tags (release versions)
Click the Test Connection button in the Source tab to verify if the GitLab token is valid before building. This is useful for detecting token expiration or permission issues early.
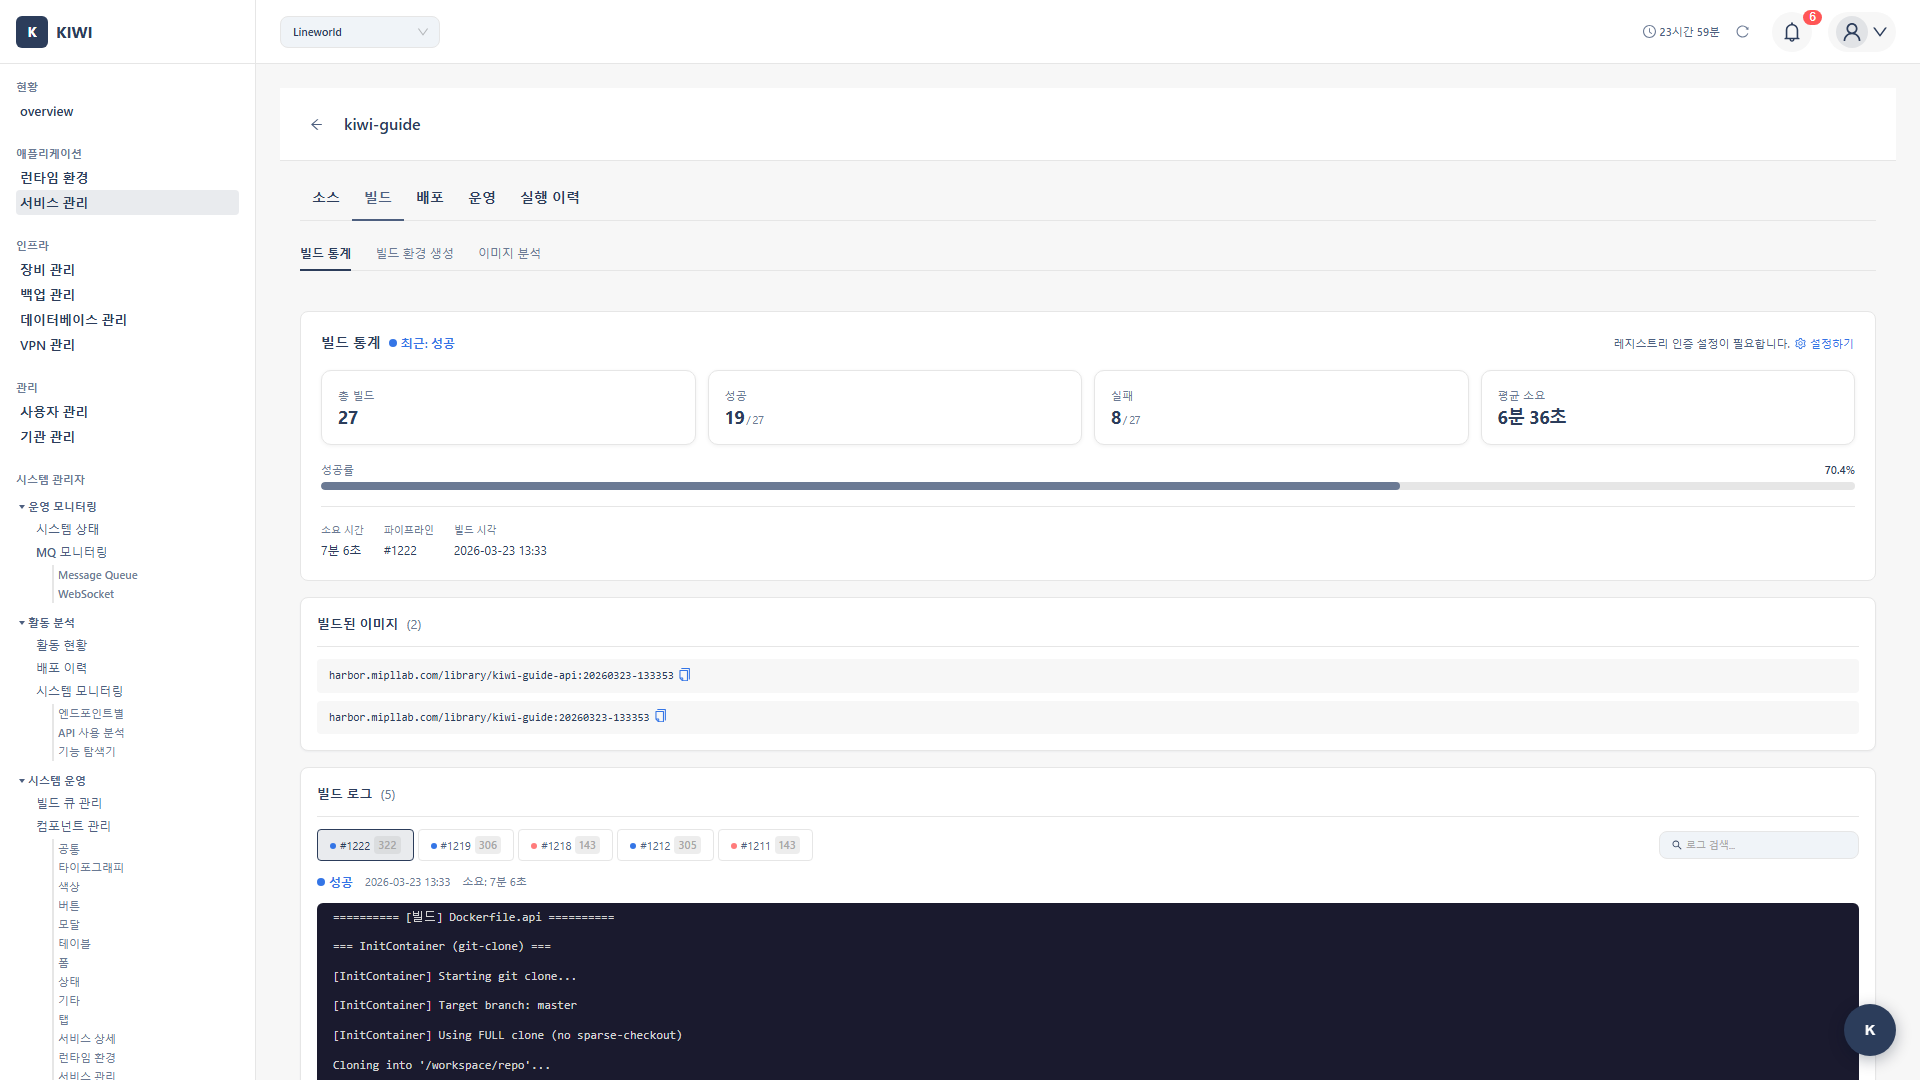
Build Management
Provides build functionality to convert code into container images.
- Kaniko Build: Create container images based on Dockerfile.
- Build Logs: View real-time build progress.
- Build History: View and compare past build records.
- Build Settings: Configure Dockerfile path, build arguments (ARG), and image tag rules.
Kaniko is a tool for building images inside containers without a Docker daemon. It enables secure image building in Kubernetes environments without privilege escalation, making it widely used in security-sensitive environments.
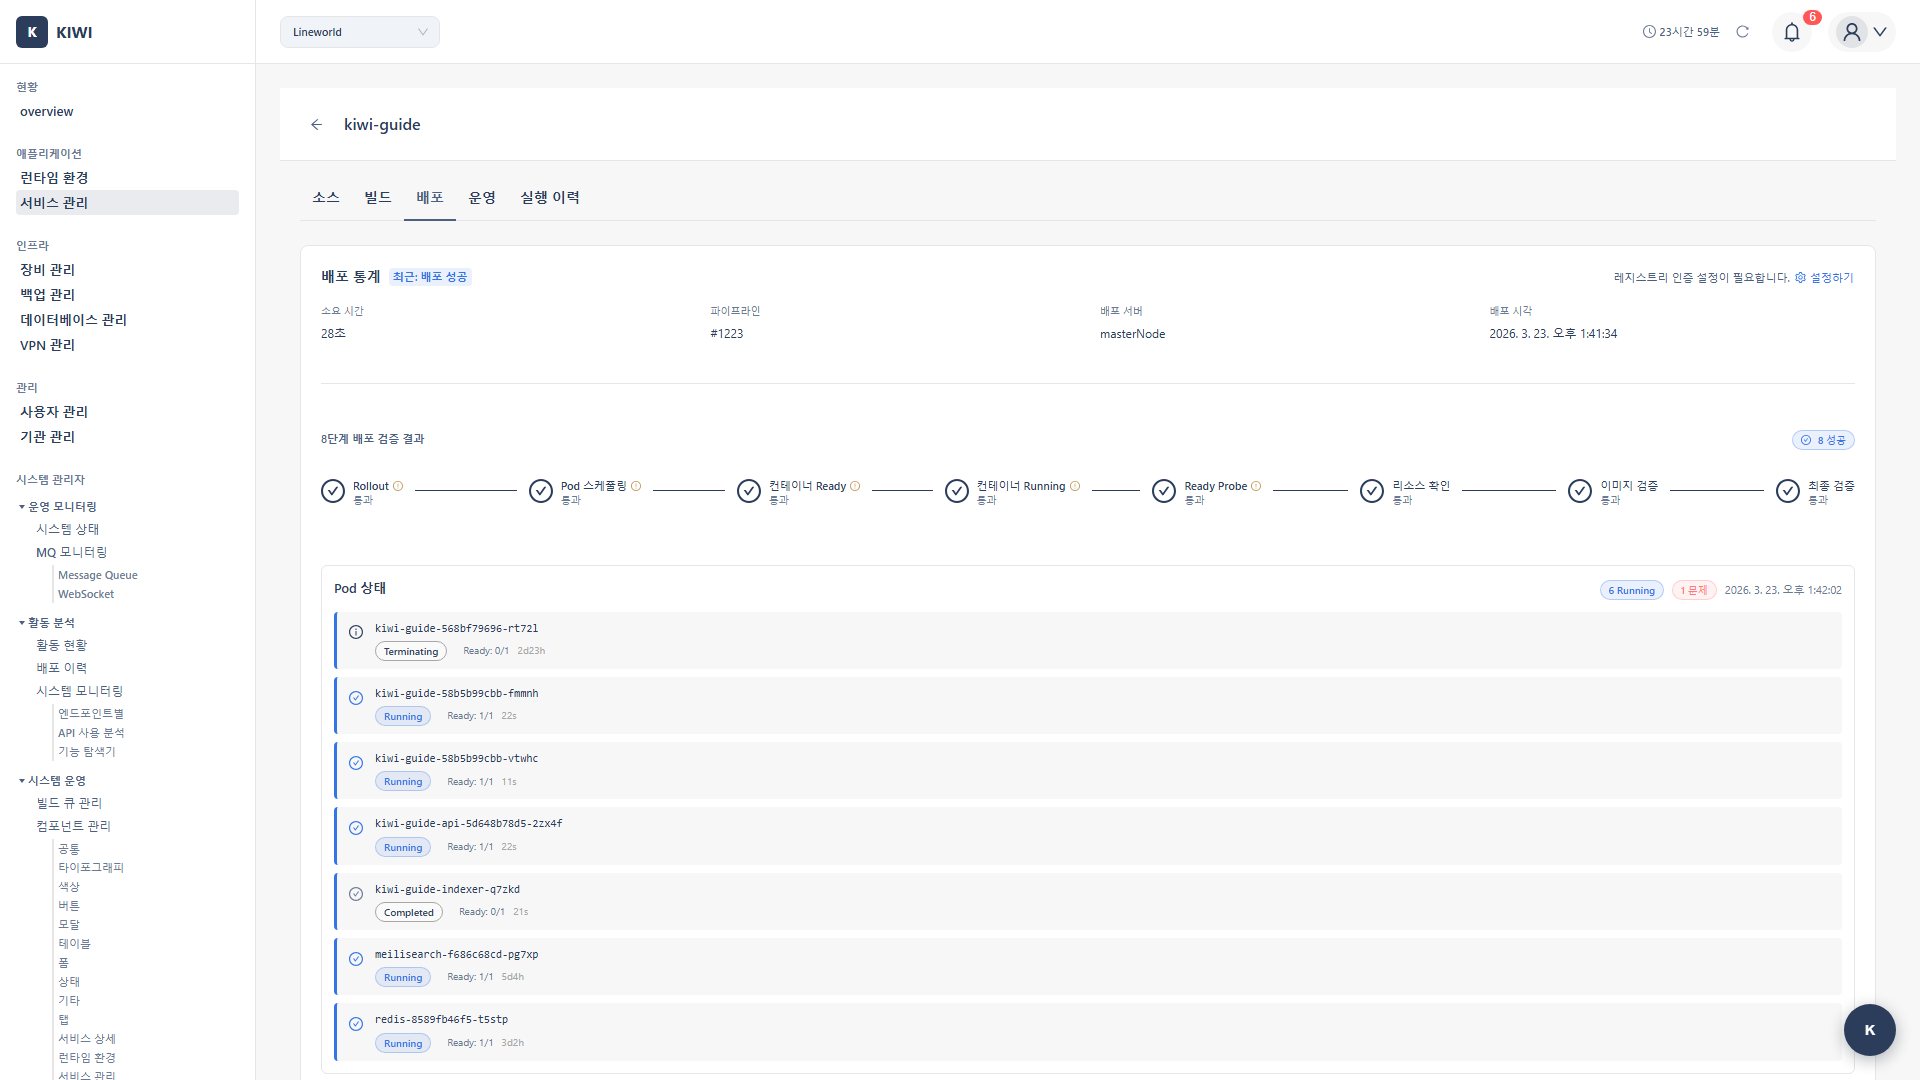
Deployment Management
Provides functionality to deploy built images to actual runtime environments.
- K8s Deploy: Deploy Deployment, Service, and other resources to Kubernetes clusters.
- Docker Deploy: Deploy containers directly to Docker hosts.
- Rollback: Instantly revert to previous versions when issues occur.
- Deployment History: View deployment records and compare versions.
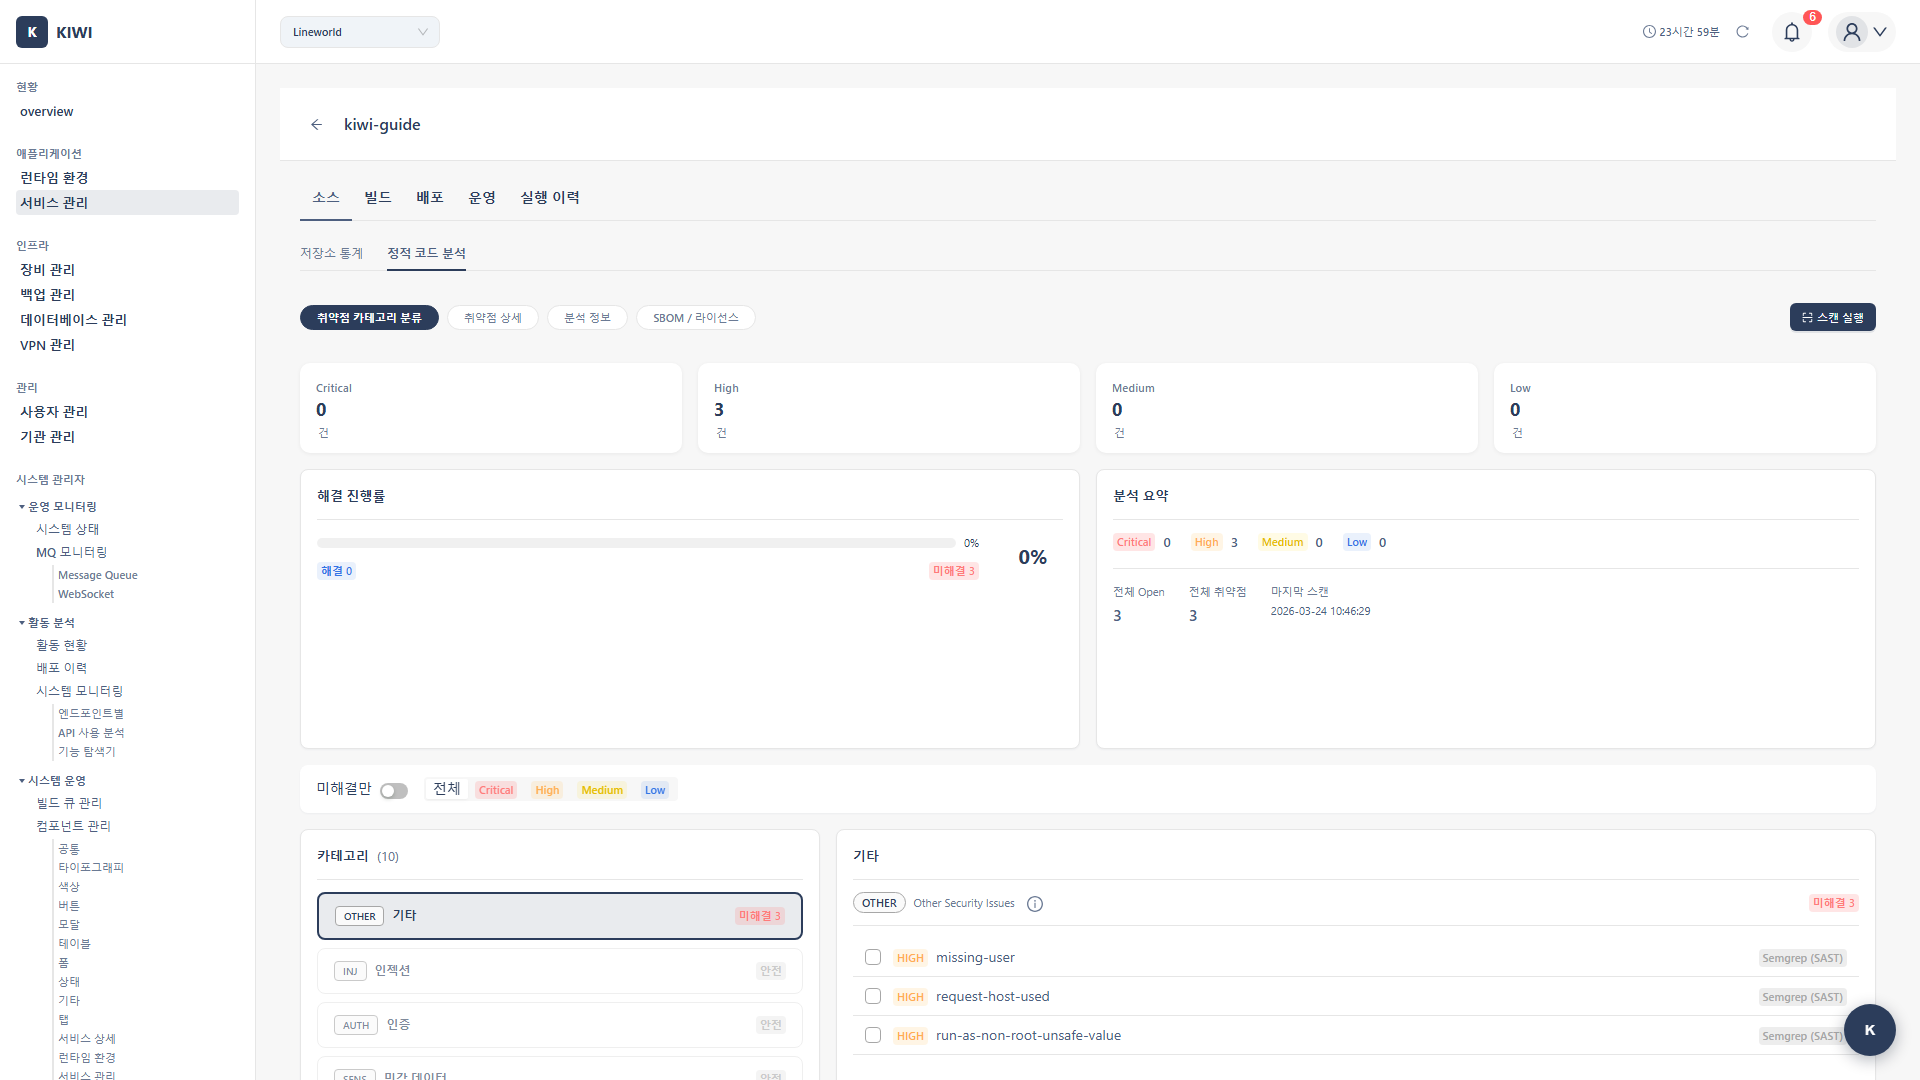
Security Analysis
Provides security scanning features at the core of the DevSecOps pipeline. Discover and address security vulnerabilities from the early stages of development.
- SAST: Analyzes source code using CodeQL and Semgrep. Use after code writing or when creating PRs.
- SCA: Analyzes open source dependencies using Trivy. Use when updating dependencies or before builds.
- SBOM: Analyzes software components. Use before releases or during audit preparation.
- DAST: Analyzes running applications using ZAP. Use after deploying to staging environments.
DevSecOps is an approach that integrates Development, Security, and Operations to embed security throughout the software development lifecycle. It realizes "security from the start" rather than "security later."
UI Layout
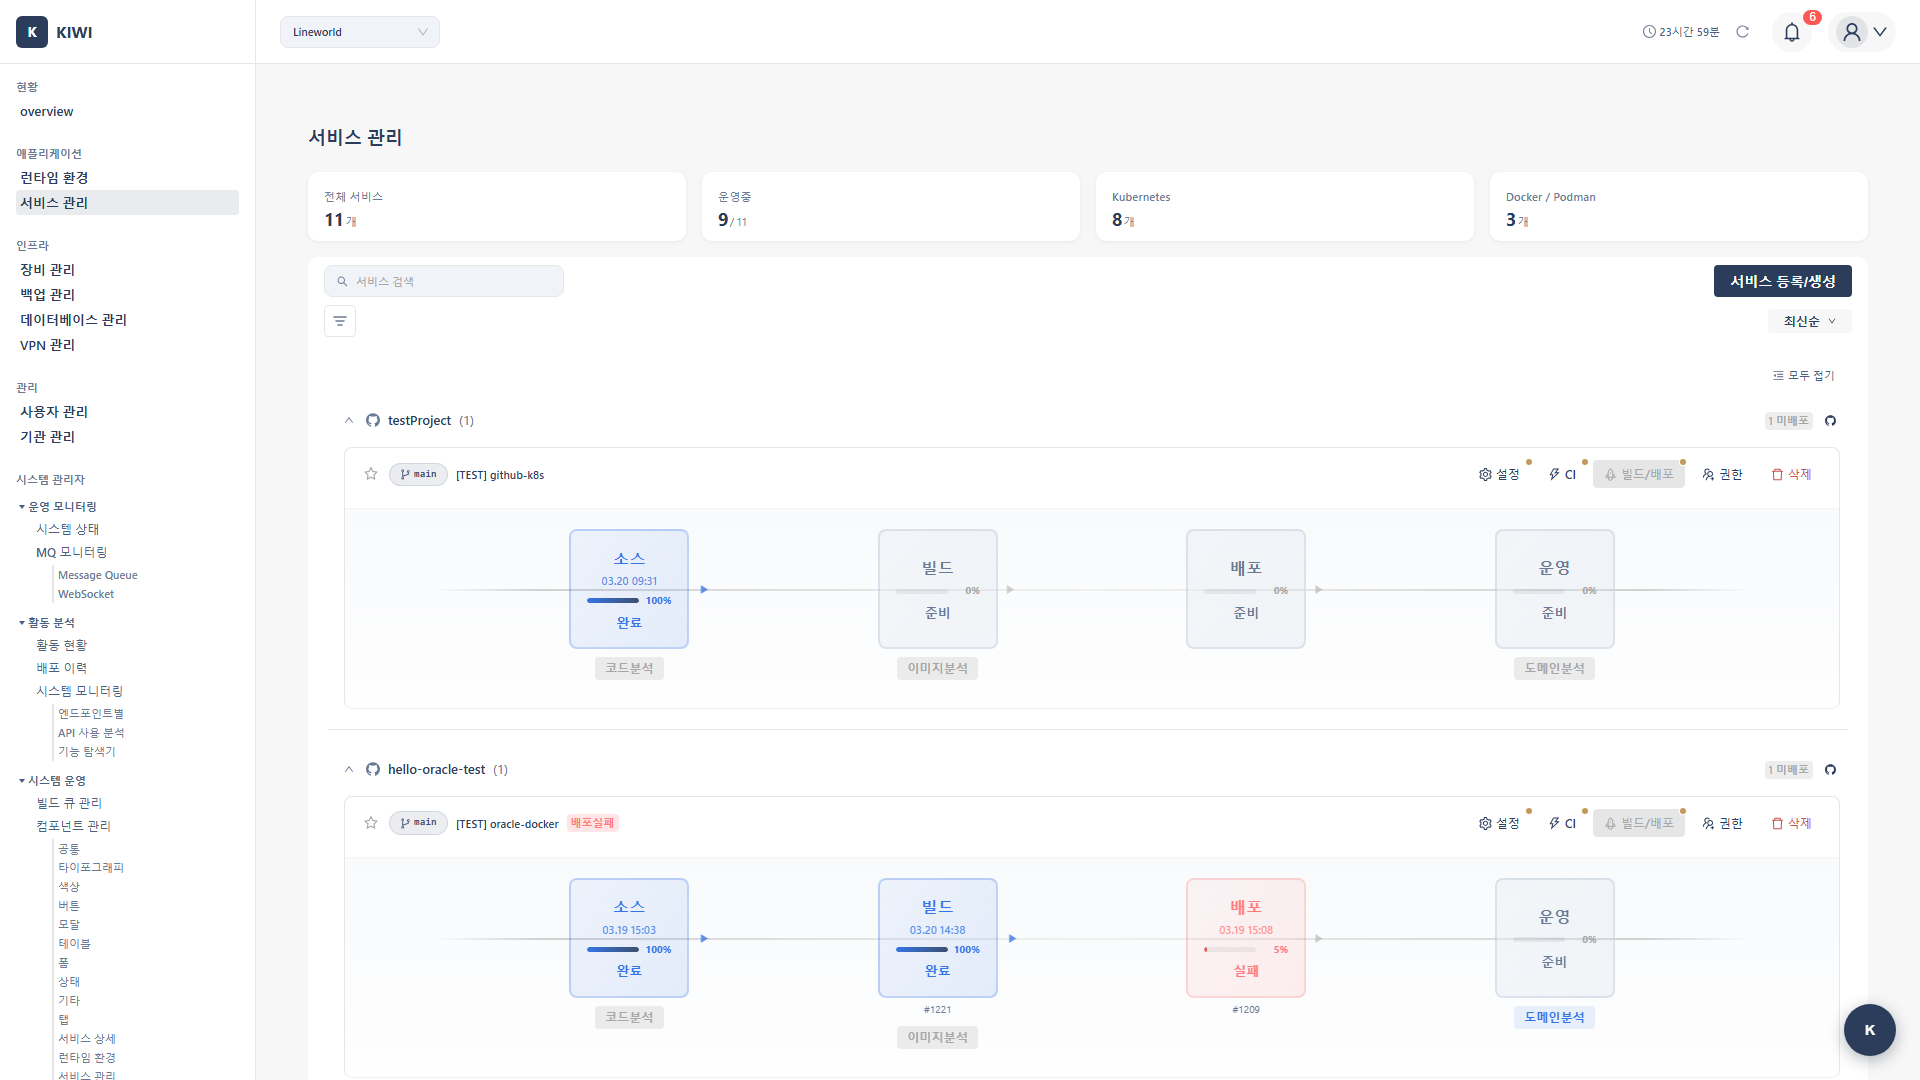
Service List
The service list page allows you to see all registered services at a glance.
- Name: Unique name identifying the service.
- Git Repository URL: Connected GitLab repository address.
- Default Branch: Primary branch (main, develop, etc.).
- Build/Deploy Status: Current build and deployment status (Success/Failed/Running).
- Vulnerability Summary: Critical/High/Medium/Low vulnerability counts.
Each service row has Build, Deploy, and Settings buttons for performing key actions directly from the list.
Service Detail Tabs
Clicking a service takes you to the detail page. Various features are available in each tab.
- Source: Git repository connection status, branch/tag management. SAST (static analysis) scan results are also shown in this tab.
- Build: Build settings, log viewing, build history management. SCA (open source vulnerability) scan and image analysis results are also shown in this tab.
- Deploy: Deployment environment settings, deployment execution, deployment history.
- Operate: Manage deployed services. Available tabs vary by runtime environment.
- K8s: Overview, Pod List, Deployment Management, Resource Status, Logs, Command Execution, Domain Settings, Domain Analysis (DAST)
- Docker/Podman: Overview, Container List, Deployment Management, Operations Management, Logs, Command Execution, Domain Settings, Domain Analysis (DAST)
- Runs: Complete pipeline execution history.
Source Tab Screen
Build Tab Screen
Deploy Tab Screen
Runs Tab Screen
How to Use
Registering a Service
This is the process of registering a new service with KIWI.
-
Click the Add Service Button
- Click the Add Service button at the top of the Service Management page.
-
Enter Basic Information
- Service Name: Enter a unique name that is easily identifiable within the team. (e.g.,
user-api,payment-service) - Description: Briefly describe the role of the service.
- Repository URL: Enter the full URL of the GitLab repository. (e.g.,
https://gitlab.example.com/team/project.git)
- Service Name: Enter a unique name that is easily identifiable within the team. (e.g.,
-
Enter GitLab Token
- Enter the Personal Access Token issued from GitLab.
- The token requires at least
read_repositorypermission.
-
Select Branch
- Once token authentication is complete, the branch list will be displayed.
- Select the branch to use as default. (typically
mainordevelop)
-
Save
- Review all information and click the Save button.
Go to GitLab → Profile icon → Settings → Access Tokens. Set an expiration date and select the read_repository scope.
Configuring a Build
Configure the build environment for your service. Once set up, it will be automatically applied to subsequent builds.
-
Navigate to Build Tab
- Select the Build tab on the service detail page.
-
Open Build Settings
- Click the Build Settings button.
-
Configure Dockerfile Settings
- Dockerfile Path: Path relative to project root (default:
./Dockerfile) - Build Context: Directory containing files to use during Docker build (default:
.)
- Dockerfile Path: Path relative to project root (default:
-
Set Build Arguments (Optional)
- Enter values to pass as
ARGin the Dockerfile using key=value format. - Example:
NODE_ENV=production,API_URL=https://api.example.com
- Enter values to pass as
-
Configure Image Tag Rules
- Define the tag rule for built images.
- Available variables:
${BRANCH},${SHORT_SHA},${TAG},${BUILD_NUMBER} - Example:
${BRANCH}-${SHORT_SHA}→main-a1b2c3d
-
Configure Registry Settings
- Select the registry to store images. (Harbor, etc.)
-
Save
Build context determines the scope of files accessible by COPY and ADD commands in the Dockerfile during Docker build. Usually the project root (.) is used, but in monorepo structures, you can specify a specific subdirectory.
Running a Build
Execute a build for a configured service.
-
Navigate to Build Tab
- Select the Build tab on the service detail page.
-
Click Start Build
- Click the Start Build button.
-
Select Build Options
- Branch/Tag: Select the source code version to build.
- Use Cache: Choose whether to reuse layers from previous builds. Using cache reduces build time.
-
Click Start Button
- The build starts and real-time logs are displayed.
-
Check Results
- When the build completes, you can check the success/failure status and the generated image tag.
- Leverage Cache: Reuse cache for unchanged layers.
- Multi-stage Builds: Exclude unnecessary build tools from the final image in the Dockerfile.
- Small Base Images: Using
alpine-based images speeds up builds and deployments.
Deploying a Service
Deploy built images to runtime environments.
-
Navigate to Deploy Tab
- Select the Deploy tab on the service detail page.
-
Select Deployment Environment
- Choose between Kubernetes or Docker as the target environment.
-
Click Deploy Button
- Clicking Deploy opens the deployment settings modal.
-
Configure Deployment Options
- Namespace (K8s): Kubernetes namespace to deploy to
- Replicas: Number of Pods to run (2 or more recommended for availability)
- Resources: CPU/memory requests and limits.
- Environment Variables: Environment variables to inject into the container.
-
Execute Deployment
- Review settings and click the Execute Deployment button.
Replicas are the number of identical Pod copies. Running multiple copies means if one fails, other copies can handle requests, improving service availability. It also allows load distribution across multiple Pods.
Running a Security Scan
Analyze security vulnerabilities in your developing service.
-
Navigate to Security Tab
- Select the Security tab on the service detail page.
-
Select Scan Type
-
Choose the appropriate scan type for your purpose:
-
SAST Scan: Recommended before code commits or when creating PRs.
-
SCA Scan: Recommended when updating dependencies or before builds.
-
Generate SBOM: Recommended before releases or during audit preparation.
-
DAST Scan: Recommended after deploying to staging environment.
-
-
Execute Scan
- Click the Execute button for the selected scan type.
-
Review Results
- When the scan completes, a list of discovered vulnerabilities is displayed.
- You can check the severity, location, and remediation methods for each vulnerability.
DAST simulates attacks against actual applications. Run only in test environments. Running in production environments may cause service outages or data corruption.
Managing Vulnerabilities
Review and address discovered vulnerabilities.
-
Review Vulnerability List
- Check the list of discovered vulnerabilities in the Security tab.
- Filter by severity to prioritize.
-
Review Detailed Information
- Clicking a vulnerability displays detailed information:
- Vulnerability description and CVE information.
- Affected code location
- Recommended remediation
- Clicking a vulnerability displays detailed information:
-
Take Action
- Fix: Fix the code and re-scan to confirm resolution.
- Ignore: Mark as ignored using VEX if not exploitable in the environment.
- Plan: Register a remediation plan if immediate fixing is difficult.
VEX is a standard format for describing the actual impact of vulnerabilities. For example, if a vulnerability is not exploitable because a specific function is not used, it can be marked as "not_affected" to reduce unnecessary alerts.
Auto CI Settings
Configure automatic builds and deployments when code changes. Reduce manual work and maintain consistent quality.
Automatic Build Triggers
- Branch Push: Automatic build when code is pushed to a specific branch. Use case example: Build dev environment on
developbranch push. - Tag Creation: Automatic build when a Git tag is created. Use case example: Release build on
v1.0.0tag creation. - Specific File Changes: Build when designated files/paths are changed. Use case example: Build only on
src/**changes (exclude docs).
CI is a development practice where developers frequently integrate code changes and perform automated builds and tests. It helps find problems early and prevents "it works on my machine" situations.
Configuration
-
Navigate to Settings Tab
- Select the Settings tab on the service detail page.
-
Open Auto CI Settings
- Click the Auto CI Settings button.
-
Configure Trigger Conditions
- Select desired trigger conditions and enter detailed values.
- Multiple conditions can be combined.
-
Save
- Once saved, settings are applied immediately.
developbranch: Auto build + dev environment deploy on pushmainbranch: Auto build + staging environment deploy on pushv*tags: Auto build + production environment deploy on tag creation.
Webhook Environment Management
When Auto CI is configured, a Webhook is needed for GitLab to deliver code change events to KIWI. KIWI automatically generates and manages Webhook URLs for each environment.
What are Webhook Environments?
Each service has 4 default environments:
- Local: Used for testing via local tunneling (ngrok, etc.) from a developer's PC.
- Dev: Used in the development server environment.
- Staging: Used in the pre-production test environment.
- Production: Used in the live service environment.
Webhook URL Structure
Webhook URLs are composed of Organization Base URL + Service Path:
- Organization Base URL: A common URL set by the organization administrator, shared across all services in the organization.
- Webhook URL: The full URL with a service-specific path appended to the Base URL.
If the organization Base URL has not been set yet, it will be shown as "Unconfigured". Please ask your organization administrator to configure the Webhook Base URL.
How to Check Webhook Settings
- Open the Auto CI Settings modal.
- Check the status of each environment in the Webhook Environments table at the bottom of the Settings tab.
- Click a specific environment to view the Webhook URL and Secret Token.
Secret Token Management
- A unique Secret Token is automatically generated for each environment.
- GitLab uses this token for authentication when sending Webhook requests.
- If you need to change the token for security reasons, click the Regenerate button.
When a token is regenerated, the old token is immediately invalidated. You must also update the new token in GitLab's Webhook settings.
Webhook Status
- Active: The Webhook is functioning normally and has received recent events.
- Ready: Configuration is complete but no events have been received yet.
- Unconfigured: The organization Base URL is not set, so the Webhook cannot be used.
- Inactive: Manually deactivated.
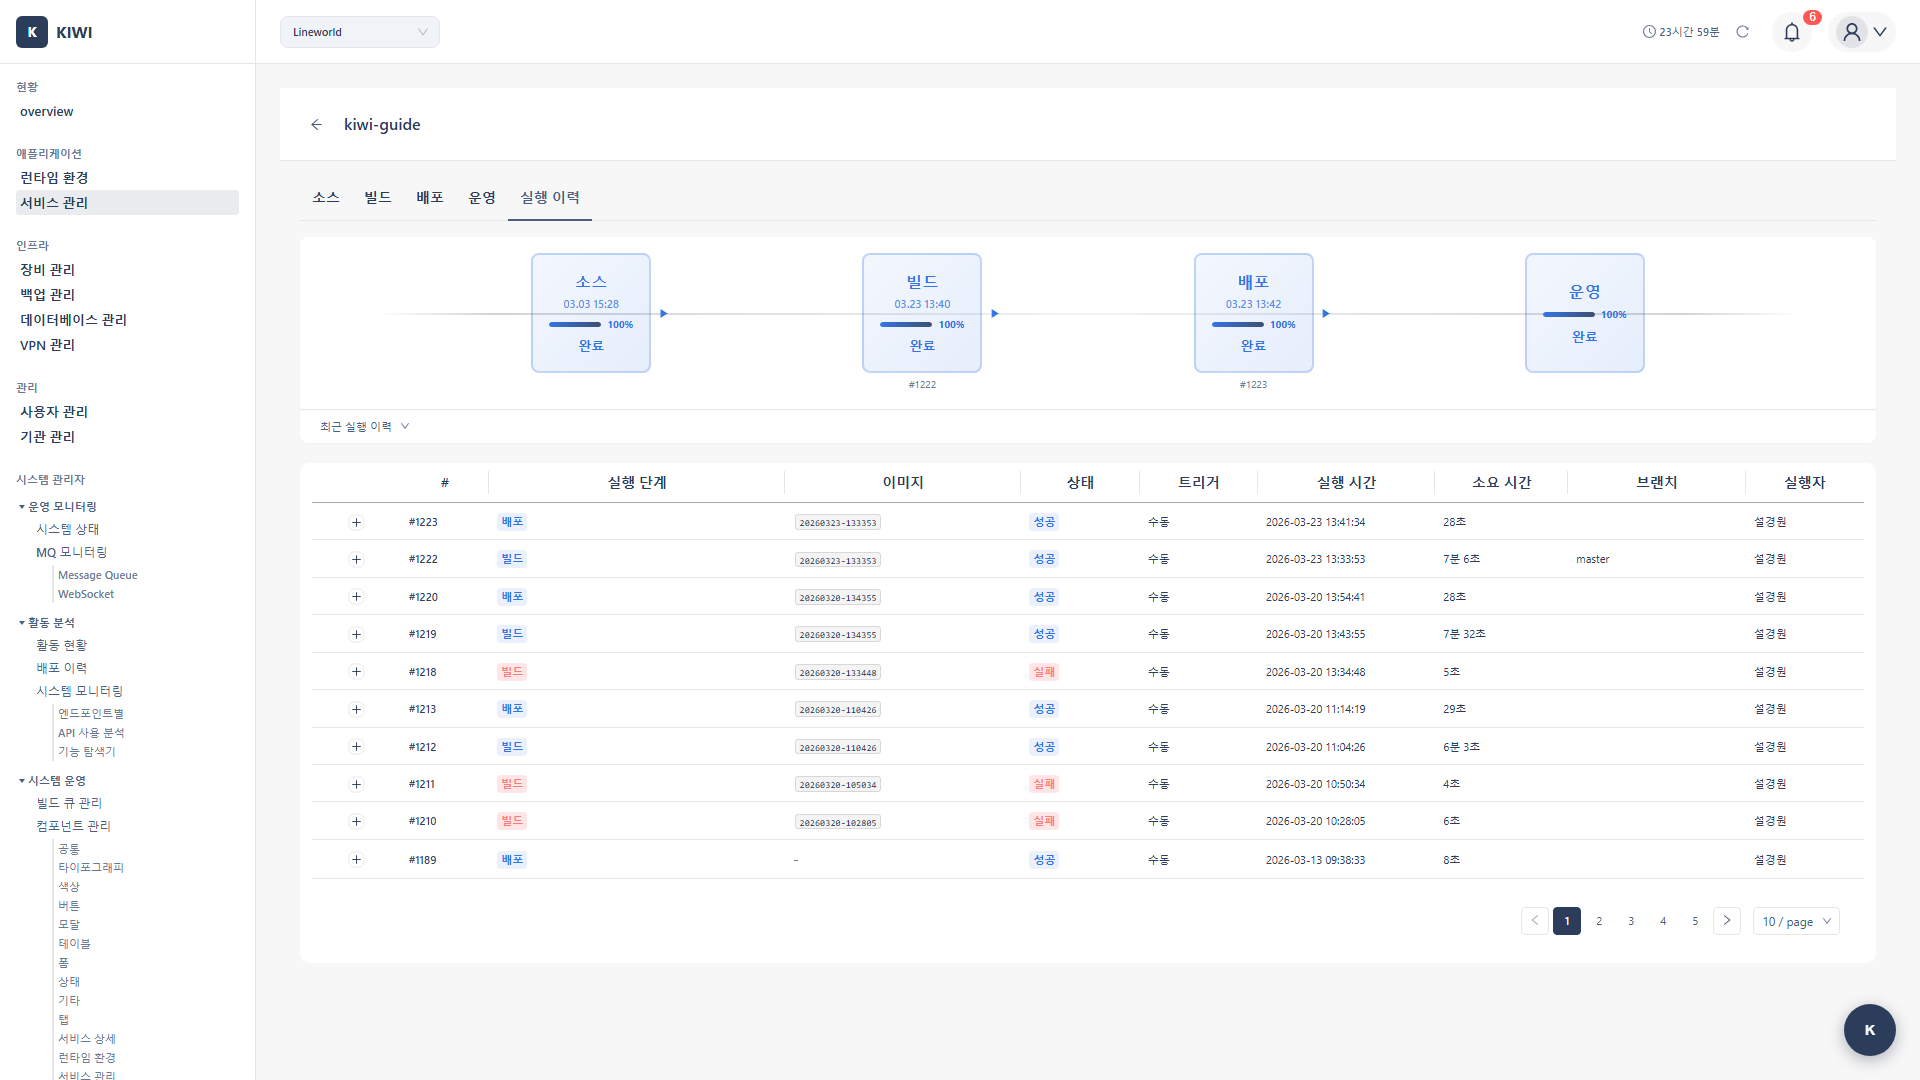
Execution History
A page where you can view all pipeline execution records for a service at a glance. Useful for troubleshooting and performance analysis.
How to Access
Click the Runs tab on the service detail page.
Available Information
- Run Number: Unique identifier for each pipeline execution (#1, #2, ...).
- Execution Steps: Displays progress status of each step (Source, SAST, Build, SCA, Deploy, Operate, DAST) with color coding.
- Image Tag: Tag information of the built container image.
- Status: Overall pipeline execution status (Success/Running/Failed/Pending).
- Trigger: How the execution was initiated (Manual/Webhook/Scheduled).
- Start Time: When the pipeline started.
- Duration: Total time taken for pipeline execution.
- Branch: Git branch used for build/deploy.
- Executor: User who executed the pipeline.
Detailed View
Expanding each execution record shows a timeline of individual steps. You can see the start time, end time, duration, and status of each step in detail, which is useful for finding bottlenecks or diagnosing problems.
- Build Time Trend Analysis: Check if build times are gradually increasing.
- Failure Pattern Identification: Analyze if failures frequently occur at specific steps.
- Deployment History Tracking: Audit when, who, and which version was deployed.
Operational Features (OperateModal)
Perform real-time operational tasks on deployed services. Provides tools for quick response when issues occur.
Log Viewing
-
Open Operate Modal
- Click the Operate button in the service list.
-
Select Logs Tab
- Select the Logs tab in the modal.
-
Configure Log Options
- Container: Select the container to view (if multiple)
- Line Count: Number of log lines to display (100, 500, 1000, etc.)
- Live: Automatically display new logs.
- Filter: Show only logs containing specific keywords.
-
Download Logs
- Download log files as needed.
Container Restart
-
Select Restart Tab in Operate Modal
-
Select Restart Target
- Select the container or Pod to restart.
-
Execute Restart
- Click the Restart button and monitor progress.
Restarting may cause temporary service interruption. For zero-downtime restarts, maintain 2 or more replicas and use rolling updates.
Resource Monitoring
View real-time container resource usage. (Requires Metrics Server)
- CPU: CPU utilization (%). Watch when consistently above 80%.
- Memory: Memory usage. Watch for risk of OOM when approaching limits.
To use resource monitoring features, Metrics Server must be installed on the Kubernetes cluster. You can install it from the Monitoring tab on the [Runtime Environments] page.
Shell Access (K8s)
Connect directly inside containers to execute commands.
- Select Shell Tab
- Select Pod and Container
- Connect to Terminal
- Execute Commands
Shell access is recorded in audit logs. Use only when absolutely necessary in production environments, and prefer log viewing or monitoring tools first when possible.
Rollback (Rollout)
If issues occur after deployment, you can rollback to a previous version. (K8s only)
- Select Rollback Tab in Operate Modal
- Review Rollout History: A list of previous deployment versions is displayed.
- Select Rollback Target: Choose the version you want to revert to.
- Execute Rollback: Rollback to the selected version proceeds.
Rollback works based on Kubernetes Deployment revisions. After rolling back, you can still revert to the previous version again.
HPA Management (Auto Scaling)
Manage HPA (Horizontal Pod Autoscaler) which automatically adjusts Pod count based on traffic. (K8s only)
- Select HPA Tab in Operate Modal
- Create HPA:
- Minimum Replicas: Minimum number of Pods to maintain
- Maximum Replicas: Maximum number of Pods to scale to
- CPU Threshold: CPU utilization threshold for scale-out (e.g., 80%)
- Memory Threshold: Memory utilization threshold for scale-out (optional)
- Edit/Delete HPA: Modify or delete existing HPA settings.
Metrics Server must be installed for HPA to function properly. You can check Metrics Server status in the HPA tab, and an install button will appear if not installed.
Build/Repository Statistics
Get an overview of service development and build status at a glance.
Build Statistics
- Total Builds: Total number of build executions. Use to understand development activity level.
- Build Success Rate: Percentage of successful builds. Below 90% needs improvement.
- Average Build Time: Average time per build. Consider optimization if over 5 minutes.
- Recent Builds: Recent build list. Use to check latest changes.
Repository Statistics
- Total Commits: Total number of commits.
- Active Branches: Number of currently active branches.
- Contributors: List of developers who contributed.
- Recent Commits: Recent commit list.
Glossary
If you encounter unfamiliar terms, check here.
- Microservice: An architecture that composes applications from small, independently deployable service units.
- Container Image: An immutable filesystem packaging an application and its execution environment.
- Registry: A repository for storing and distributing container images (Harbor, Docker Hub, etc.).
- Dockerfile: A text file containing commands for building a container image.
- Tag: A label attached to a specific commit in Git, typically used to mark release versions.
- Rolling Update: A method of gradually deploying new versions without service interruption.
Notes
- DAST scans should only be run in test environments. Running in production environments may affect services.
- Operational tasks (log viewing, Shell access, etc.) are all recorded in audit logs.
- Git tokens are encrypted and stored securely.
- Build logs are automatically deleted after a certain period.
- Download and preserve important logs in advance.