Shell Access
Sometimes logs alone are not enough to identify the problem. In such cases, the Shell Access feature allows you to execute commands directly inside a Pod or Container for in-depth debugging.
There are things that don't show up in logs. When you need to directly check environment variables, the file system, network connection status, and more, you need Shell access. It's like SSH-ing into a server.
Feature Overview
KIWI's Shell Access feature uses kubectl exec or docker exec commands under the hood.
- Kubernetes: Executes the same way as
kubectl exec -it <pod> -- <command> - Docker/Podman: Executes the same way as
docker exec -it <container> <command>
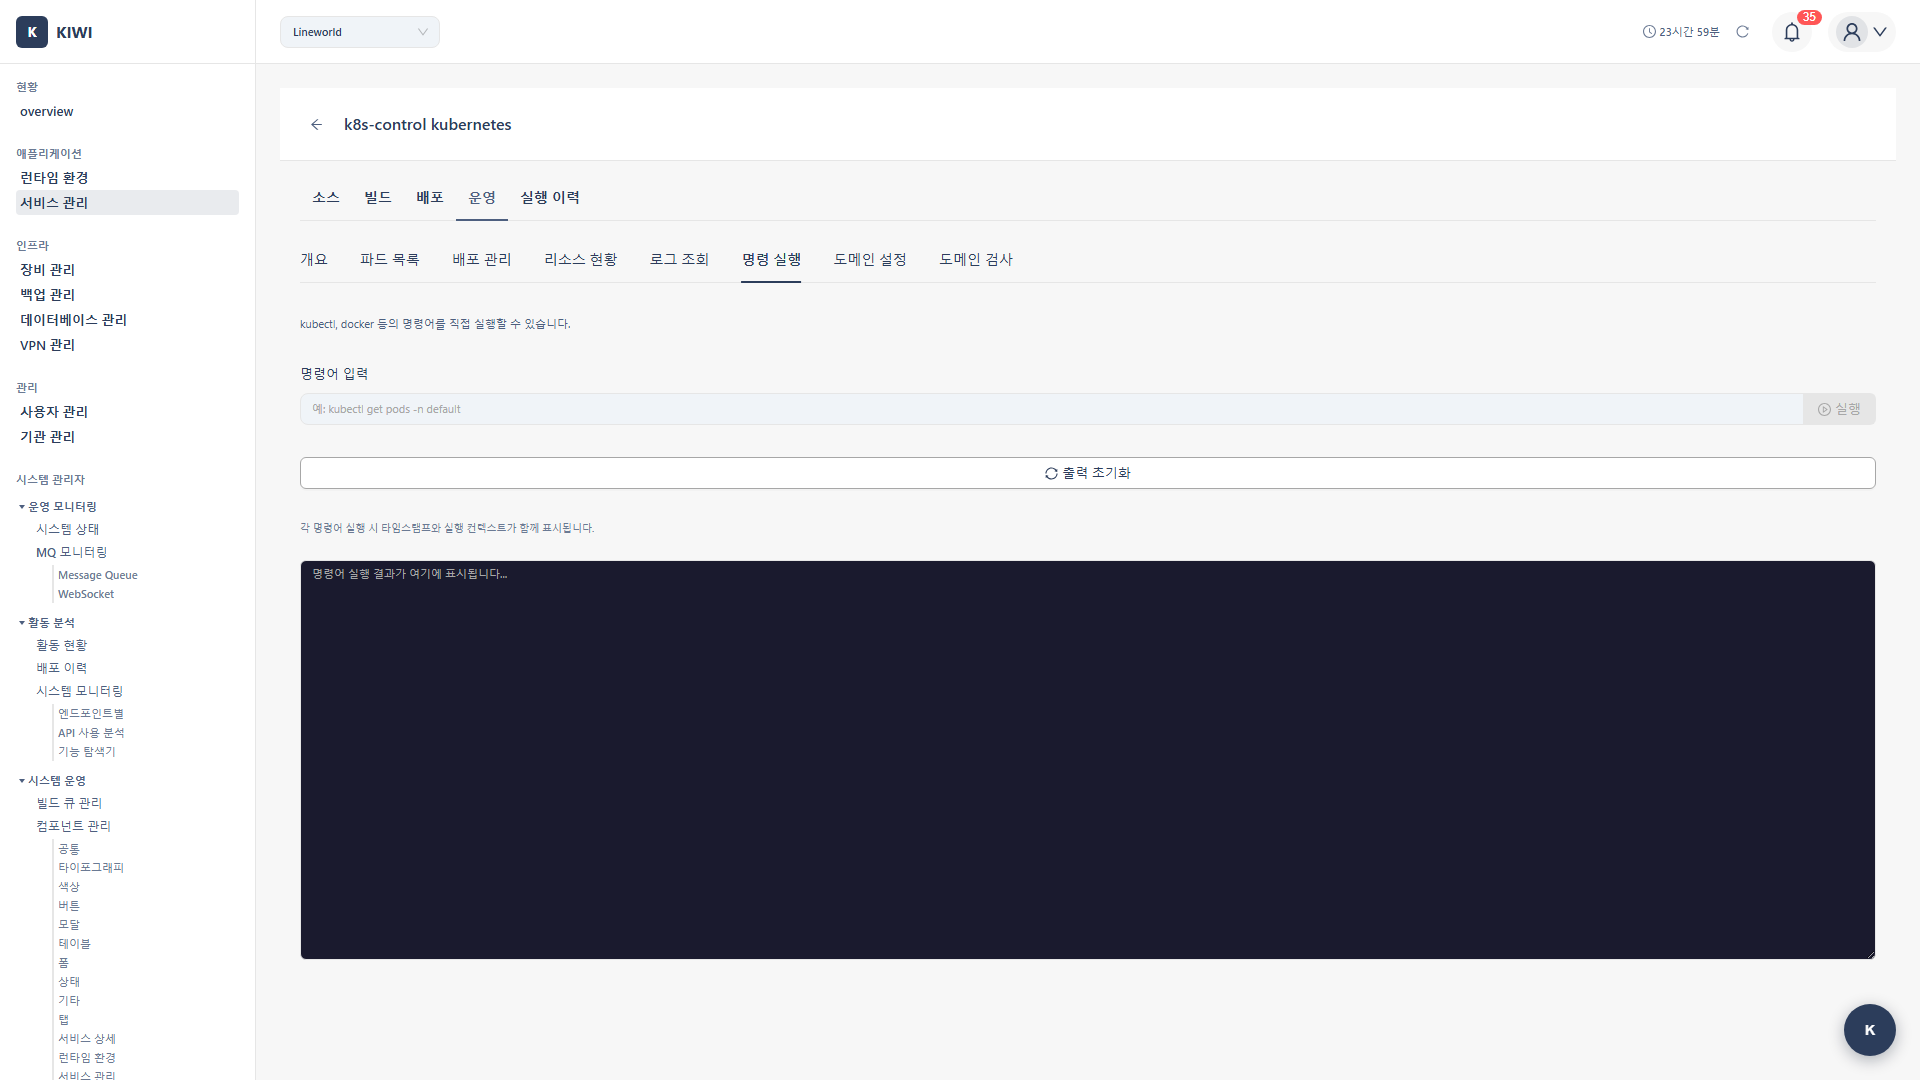
Accessing the Execute Tab
- [Service Management] → Select a service .
- Click the Operate stage
- Select the Execute tab
How to Execute Commands
Step 1: Select the Target
- Kubernetes: Select the target Pod from the Pod dropdown
- Docker/Podman: Select the target container from the container dropdown
Step 2: Enter the Command
- Enter the command to run in the command input field
- Click the Execute button or press Enter .
- The result is displayed in the area below
Step 3: Review the Result
- The command output is displayed in the output area
- Error messages are displayed if an error occurs .
- Multiple commands can be run consecutively .
Commonly Used Commands
Here are commands frequently used in practice. Copy and use the ones you need.
If you're not familiar with Linux commands, start with read-only commands (cat, ls, ps, etc.) first. They're safe because they don't change the system.
System Information
Commands to check basic system status.
# Check OS information
cat /etc/os-release

# Check hostname
hostname

# Check current time
date

# Check server uptime
uptime
Checking Processes
# Full process list
ps aux

# Search for a specific process
ps aux | grep java

# Process tree
pstree

# Sort by memory usage
ps aux --sort=-%mem | head -10

# Sort by CPU usage
ps aux --sort=-%cpu | head -10
Resource Monitoring
# Memory usage
free -m

# Disk usage
df -h

# Directory size
du -sh /app/*

# Network statistics
netstat -tlnp
# or
ss -tlnp
Network Checks
# Network interfaces
ip addr
# or
ifconfig

# DNS check
cat /etc/resolv.conf
nslookup google.com

# Port connection test
nc -zv <host> <port>

# HTTP request test
curl -v http://localhost:8080/health
wget -qO- http://localhost:8080/api/status
File System
# File list
ls -la /app/

# View file contents
cat /app/config/application.yml

# File search
find /app -name "*.log"

# View end of file (log check)
tail -100 /var/log/app.log

# Real-time log (Follow)
tail -f /var/log/app.log
Environment Variables
# All environment variables
env

# Search for specific environment variable
env | grep -i database

# Check environment variable value
echo $DATABASE_URL
echo $NODE_ENV
Java Applications
# JVM memory status
jstat -gc <pid>

# Heap dump
jmap -dump:format=b,file=/tmp/heap.hprof <pid>

# Thread dump
jstack <pid>

# Check GC log
tail -100 /var/log/gc.log
Node.js Applications
# Node.js version
node --version

# npm package list
npm list --depth=0

# Check environment
node -e "console.log(process.env)"
Python Applications
# Python version
python --version

# Installed packages
pip list

# Package details
pip show <package>
Debugging Scenarios
Let's walk through how to debug real problem situations step by step.
Scenario 1: Diagnosing Insufficient Memory
When a Container keeps restarting due to OOM (Out of Memory).
Symptom: Container suddenly terminates and shows "OOMKilled" status.
Diagnostic Commands:
# Check current memory usage
free -m

# Top 5 processes using the most memory
ps aux --sort=-%mem | head -5
Analysis: Check which process is using the most memory.
Response:
- Increase the memory limit .
- Or fix the code if there's a memory leak
Setting the limit to about 1.5-2x your application's average memory usage is a good practice for stability.
Scenario 2: Network Connection Issue
- Symptom: DB connection failure
- Execute commands:
nc -zv database-host 5432
nslookup database-host - Analyze results: Check DNS resolution or port connectivity .
- Response: Check network policies and service endpoints .
Scenario 3: Verifying Configuration Files
- Symptom: Abnormal application behavior
- Execute commands:
cat /app/config/application.yml
env | grep -i config - Analyze results: Verify configuration values .
- Response: Modify ConfigMap/environment variables .
Scenario 4: Insufficient Disk Space
- Symptom: Log file write failure
- Execute commands:
df -h
du -sh /var/log/*
ls -la /var/log/*.log - Analyze results: Identify which files/directories are consuming space .
- Response: Clean up logs, increase volume size
Cautions
Exercise caution when executing commands in a Production environment:
- Use data-modifying commands (rm, mv, truncate) carefully .
- Prohibited: Resource-impacting commands (fork bomb, infinite loops)
- Be careful with screen sharing as sensitive information may be displayed .
Commands to Avoid
rm -rf /- Deletes the entire system .:(){ :|:& };:- Fork bomb (resource exhaustion)kill -9 1- Terminates PID 1 (terminates the container)chmod -R 777 /- Security vulnerability .dd if=/dev/zero of=/dev/sda- Destroys the disk
Safe Practices
- Read-only commands first: Understand the situation with
cat,ls,ps, etc. - Test in non-production environments first: Test risky commands in development .
- Check backups: Verify backup status before modifying important files .
- Peer review: Have a colleague present for critical operations .
Permissions
Permission Notice: If you cannot access shell access features, please request permission from your organization manager. The Execute tab will be disabled without proper permissions.
Audit Log
All command executions are recorded in the audit log:
- Execution time: When the command was run
- Executor: The user who ran the command
- Target: Pod/container name
- Command: The command that was run
- Result: Success/failure
Troubleshooting
- "command not found": The command does not exist in the container. Use a different command or install the package.
- "Permission denied": Insufficient permissions. Use the --user root option if root execution is needed.
- No response: Command execution timed out. Retry with a simpler command.
- Connection failure: Pod/container is in a bad state. Check status and retry.
Containers Without a Shell
Some minimal images (distroless, etc.) do not have a shell:
# When /bin/sh is not present
# Error: executable file not found

# Alternative: Execute binaries included in the image directly
Related Guides
- Log Monitoring - Log viewing .
- Container Management - Pod/Container control
- Operations Management Overview - Full operations feature set